Market Insights

RSS

Sales and Listing Report for June 2023

Highlights of the Dexter Mid-Year 2023 Report

  • Overall housing sales were 194% higher in June compared to January

  • Composite home benchmark price is up 8% from the start of the year

  • Record high prices are being seen in suburban markets

  • Investors pile in as condo prices are nearing record highs

  • Vancouver’s benchmark home price is now higher than New York City

  • Fraser Valley housing sales are up 51.1% from June 2022

The first six months of 2023 proved a thrill ride for Metro Vancouver home buyers and sellers, who switched reins at least three times and still managed to post a surprising pace of real estate transactions, with June sales up 194% from January 2023.

As sales and prices increased, 5,466 new listings joined the action. There were 9,990 properties for sale as June ended, the highest increase month-over-month since earlier in 2022. It was still not enough to satisfy June demand as nearly 3,000 homes were sold. We are still seeing multiple offers at a pace indicative of a true seller’s market. Despite back-to-back months of higher listings, the low inventory keeps buyers competing in most markets, even detached houses in some areas.

In June, the Bank of Canada threw up another interest rate hike to slow the market, but buyers rode right over it. June’s 2,988 total home sales surpassed June 2022 and both sales and prices blew past projections.

“The market continues to outperform expectations across all segments,” said Andrew Lis, REBGV’s director of economics and data analytics. 

As they say, what a ride.

Condominium buyers, some of them investors, snapped up 1,573 apartments in June to lead the property trifecta: that was more sales than all the detached and townhome sales combined in the month. As Lis noted, “The benchmark price of a condo apartment is almost cresting the peak reached in 2022, while sales of apartments are now above the region’s 10-year seasonal average.”

Data from the Canadian Housing Statistics Program (CHSP) shows that 45.6% of Vancouver condos are owned by investors who hold at least three condo apartments. In some Fraser Valley markets, it is even higher. 

The surprise, though, is not that so many people own multiple condos, but that more don’t. You don’t need to be a statistician to figure out why buyers are drawn to condominiums.  In Greater Vancouver, the benchmark price of a condo apartment increased by $47,000 during the first six months of this year, to $767,000. In Abbotsford, which led the province with multiple owners accounting for nearly 70% of the condo investment market, the average apartment price in June was $16,000 higher than in January 2023.

With the highest rental rates in the country – a one-bedroom condo rents in Metro Vancouver for an average of $2,700 a month and can easily top $3,000 – investors with enough equity can achieve positive cash flow as they watch the condo appreciate. Thanks to new provincial regulations, virtually all condos are now rental allowable units since the province outlawed strata rental restrictions, except for a strata still being able to have an age restriction of 55-plus.  Even in those, an older tenant can still be welcomed.

Condominiums of course remain the most affordable option as first-time buyers deal with higher mortgage rates and a mortgage stress test rate of 5.25%. The detached-house benchmark is now $1,991,300 and is rising by nearly 2% per month. Scarce townhouses sold in June at a benchmark of $1,098,000, up 9% compared to the first of the year.

The Bank of Canada’s nine interest rate hikes were meant to stall housing sales, and they certainly did. In June 2023, the latest rate hike helped drive detached house sales down 19% from a month earlier, but the median price had already increased about $180,000 compared to January.

To add fuel to the inflationary fire, retail spending in B.C. is now running at a near-record high of $8.9 billion a month. 

This all points to another Bank of Canada rate hike on July 12. While inflation hit a low in the recent report in June, today’s jobs number for Canada gives the Bank of Canada fuel to increase their rate. They really shouldn’t, but quite possibly will. Further adding costs to Canadians at a time when it can least be afforded. Can this market withstand a 5% or 5.50% prime rate and a mortgage rate above 7%? We are about to find out as this fast-paced real estate year heads into the second half.

Regional market numbers: 

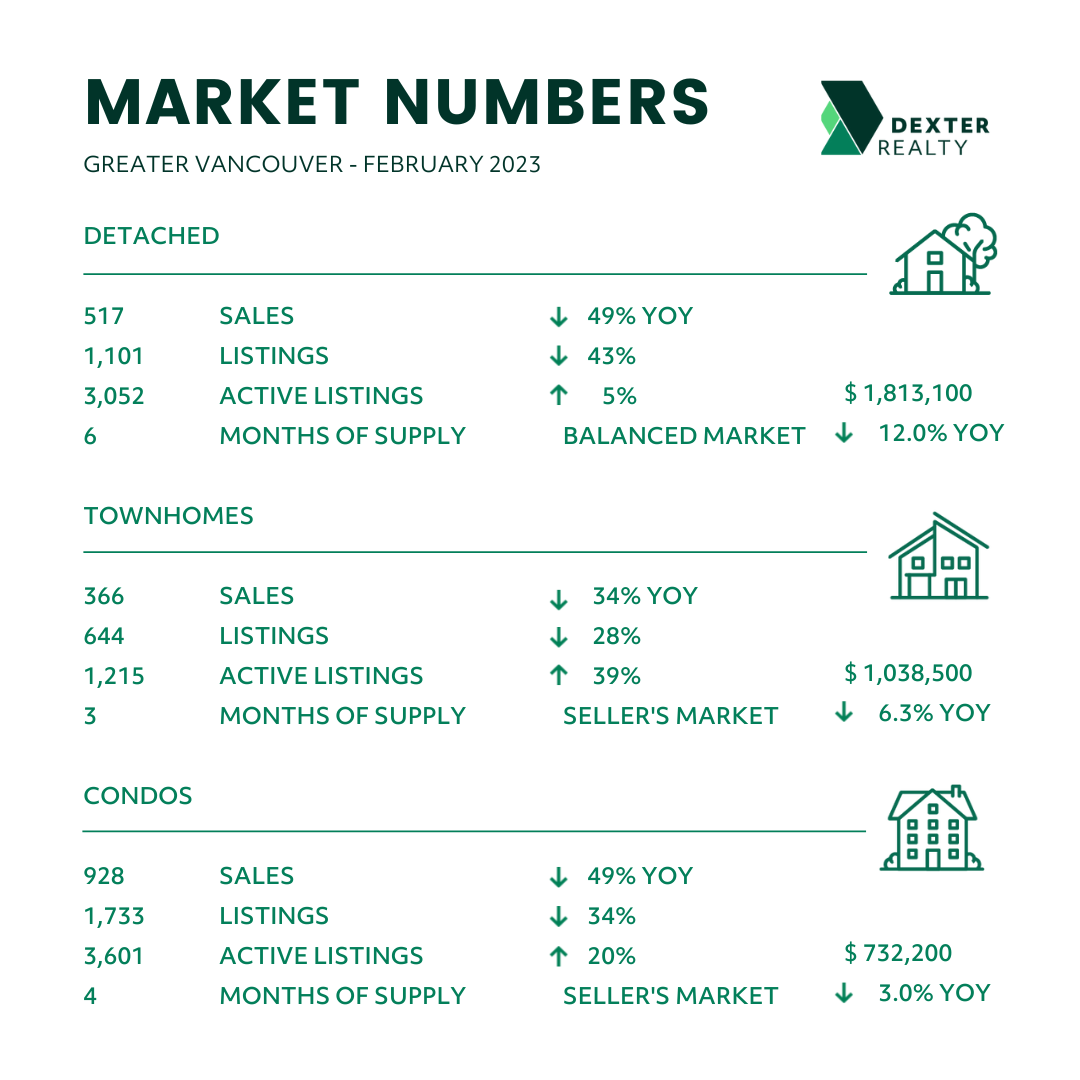
Greater Vancouver: There was only a three-month supply of total listings on the market in June and a benchmark price of $1,203,000, which was up 8.5% from the start of the year. (As a reality check, the comparable benchmark price in New York City is US$829,000, or $1.12 million Canadian.) Townhomes continue to be the least available home in the market, and that will continue to be that theme for years to come. In the first quarter of this year, only 112 new townhouses started construction.  It is not a priority of city planners and there is no creativity to densify with townhouses, be it a strata or the rare freehold row homes. With the price of land so high in Vancouver, the cost of construction at record levels and municipal development fees increasing, developers are forced to build to the maximum density allowed to reach any relative level of affordability. Active listings flirted with 10,000 during the month but finished at 9,990. June’s overall sales-to-listing ratio was 55%, down from 59% in May but still showed strength considering the bump up in fixed and variable rates.
 
Fraser Valley: June housing sales rocketed past all projections, soaring 51.1% from June 2022 to 1,953 transactions, which was also up 13% from May 2023. But new listings were down 3% from May and off 2.8% from a year earlier." Prices continue to trend upward, with lack of supply and high demand for housing,” noted Narinder Bains, chair of the Fraser Valley Real Estate Board. While prices were down marginally from June 2022, they continue to increase this year. The June detached house benchmark was $1,526,600, up 2.3% from May; townhouse prices increased the same amount to $845,400; and the condo apartment benchmark was up 1.8% month-over-month at $552,200.

Vancouver Westside: Just 75 detached houses sold in June, down from 109 in May but up from 71 in June 2022, while the benchmark price was $3,418,700, 9.9% higher than in January and 2.4% above May 2023, but down 3.2% from June 2022. Townhomes and condos are still in seller’s market conditions. There were only 130 new listings for townhomes in May and 62 of them sold, for a 48% sales success ratio at a benchmark price of $1,497,000, a record price that is 2.7% higher than in June 2022 and nearly $180,000 higher than in January 2023. Condos dominated sales, with 390 transactions, a sales-to-listing ratio of 50% and a benchmark price of $856,000, also a record high, and up nearly 7% from the start of the year.

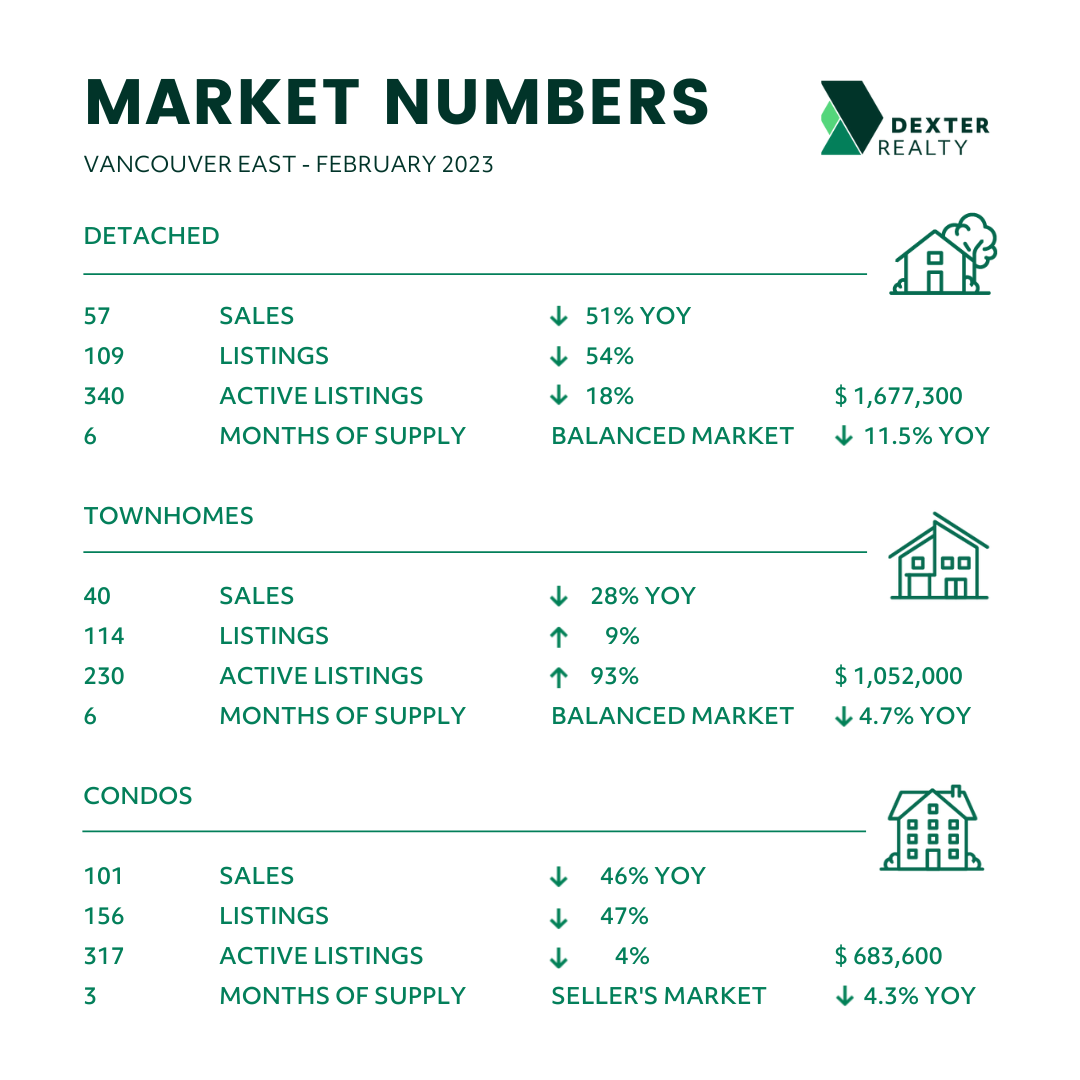
Vancouver East: The June benchmark price of a detached house in Vancouver East, at $1,879,700 was 31% higher than pre-pandemic 2019 and 9.6% higher than in January 2023. That is an increase of more than $180,000 in six months. The detached sales ratio is running at 43%, signaling a moderate seller’s market. Townhomes are deep into a seller’s market, with a sales-to-listing ratio of 61% and a benchmark price up nearly 8% from six months earlier, at $1,108,900. Good news for buyers is that townhome prices have remained nearly unchanged from three months ago. The June benchmark condo price, however, set a record in June of $856,000, up 1.2% from a year ago and 7% higher than in January 2023. In the first half, 696 condos were sold in Vancouver East, compared to 1,058 in the same period last year. Currently, the sales-to-listing ratio is 58% in this seller’s arena.

North Vancouver: With just a 2-month supply of total listings, and a sales-to-listing ratio of 68%, this is a strong seller’s market. New listings were down in all property types compared to May while the benchmark home price is the second highest in the region, at $1,409,100, a price up 8.6% from six months ago, though still 2% below June 2022. 

West Vancouver: If they can handle the prices, buyers are in control of West Vancouver’s detached-house sector, where the median price in June was $3,418,000, up more than $500,000 from a month earlier, though sales dipped to 28 transactions, down from 41 in May 2023. There is a 15-month supply of houses, with sales at the lowest level in five months. Townhome listings are disappearing: 5 new listings in June and 6 sales. The June benchmark condo price was $1,339,700, a record high, even with a relatively low sales ratio of 37%.

Richmond: With a lack of listings and a sales ratio of 57% across the board, Richmond is a seller’s market that is testing a new record high for prices. The benchmark price in June was $1,185,500, nearly matched with June of 2022 and 9% higher than in January 2023. In June, 95 detached houses sold at a benchmark of $2,182,000, up 10% from six months ago. Condo sales reached 192 units, even a month earlier, but the benchmark price was down 1% ,month-to-month at $739,800.

Burnaby East: A severe shortage of listings combined with a 73% sales-to-listing ratio is driving all prices higher. June detached house sales doubled from May 2023 even as benchmark prices hit a record high of $1,912,200 – and that was still the lowest detached price in Burnaby for the month. Mark this a seller’s market on steroids with the composite home price up 9% from the first of the year, and the strata market averaging an 83% sales success ratio with just a 2-month supply of listings.

Burnaby North: Despite the Amazing Brentwood, Gilmore and Lougheed building booms over the past few years, there is still a shortage of strata homes for sale. Townhomes, for instance, are seeing a 93% sales-to-listing ratio and June benchmark townhouse price was $903,500, up 6.7% from January 2023. Condo apartments sold at a benchmark of $753,800, the highest price on record. Still strata prices are far below detached houses, which reached $2,039,400 in June, up 2.9% from a month earlier. 

Burnaby South: This is also a seller’s market, with just a 3-month supply of listings based on current sales level. The overall sales-to-listing ratio is a robust 61%, led by condos, where 70% of new listings sold in June at a benchmark price of $812,100. A crack in the seller’s advantage is the detached house sector, with a more modest 39% sales success ratio, but the detached benchmark is $2,213,200, up 9.5% so far this year.

New Westminster: Multiple bids are now common in New Westminster, with both detached and townhomes selling for more than the list price. Not a surprise with just a 2-month supply of total listings and a total of only 40 new non-rental housing starts so far this year in the entire municipality. The benchmark townhome price in June was $945,100, up 7.2% from January 2023, while condos are selling at a record benchmark of $653,400. Detached houses were also at a record high in June of $1,570,600, up 11.6% (yes, more than $158,000) from benchmark at the start of 2023.

Coquitlam: One must wonder if supply is the answer to affordability when one looks at Coquitlam, which has been characterized by construction cranes for years. There was only a 2-month supply of strata homes on the June market and prices skyrocketed. The condo benchmark is now at an all-time high of $737,500 and is rising by 1.3% per month this year, with a sales ratio of 70%. The overall sales-to-listing ratio is 61%, which is eating into the tight supply. Detached-house benchmarks hit a record high of $1,787,000 in June and there is just a 3-month supply of houses listed. 

Port Moody: 100% of the condos listed for sale sold in June, to give an idea of the tight supply in a market blessed with SkyTrain service but cursed with a low housing starts for years. Big new strata projects are in play but still two years away from completion. June total sales were higher than in June 2021, which was the former market peak. Townhomes are selling at just over $1 million, and the benchmark condo apartment price is $728,000, 7.2% higher than in January. June saw 21 detached houses sell at a benchmark of $2,035,000, up 1.4% from May 2023 but 7% below June 2022. 

Port Coquitlam: There is a 2-month supply overall with a 65% absorption rate, but only a 1-month supply of townhomes and condos with sales ratios of 78% and 73%, respectively. The June benchmark home price, at $967,900 is up 9.2% from the first of the year, and down just 1.3% from June 2022. This is a tight seller’s market.

Pitt Meadows: This market was very popular during the COVID period and has come back into fashion this year. In June, the detached sales-to-listing ratio was 100% and the benchmark price for a detached house has soared 13.8% so far this year – the highest increase in Metro Vancouver – to $1,319,000. There were only 12 active townhouse listings and 14 condo active listings at month end.

Maple Ridge: With the composite home price rising 9.4% since January to reach $997,900, the overall market has just a 3-month supply with strata listings down to only a 2-month inventory. New listings are taking up a sales ratio of 56% in this seller’s market.

Ladner: Ladner saw the first price drop in the townhome benchmark price when it dipped a mere 0.2% from May to June’s $971,700, a price up 13.5% from January to mark the highest six-month townhouse price rise in the Metro region. There were just 11 active townhome listings at the end of June, and just 7 total condo listings. Meanwhile, the detached house benchmark was $1,422,900, up 10% from January and 14.2% higher than at the end of the first quarter. This is a seller’s market with price momentum and a sales-to-listing ratio of 62%.

Tsawwassen: This is a more balanced market in the detached-house sector, with about a 5-month supply of listings. The benchmark detached price in June was $1,596,700, up 10.8% since January at sales-to-listing ratio of 62%. Townhouse benchmarks are at $999,600, up 10.3% compared to January, and the condo benchmark in June was $690,700, 7% higher than when this year started. Strata listings are at a 3-month supply, based on current sales.

Download June Sales and Listings Statistics All Regional
Download June Sales and Listings Statistics Houses Townhouses Condos
Download Sales & Listings Images

Kevin Skipworth, Partner/Broker and Chief Economist at Dexter Realty

Read

Summary of Government Regulations & Dates
Government Regulations & Dates City of Vancouver Empty Homes Tax:
  • The City of Vancouver Empty Homes Tax is 3% for any homes deemed empty in 2023.

  • Declaration Due Date is February 2.

  • All homeowners must complete a declaration and confirm exemptions, if applicable.

  • Clauses required in CPS to protect the buyer.

  • More information: City of Vancouver Empty Homes Tax

B.C. Speculation and Vacancy Tax:
  • The BC Speculation and Vacancy Tax is 0.5% for Canadian Citizens or Permanent Residents and 2% for foreign owners and satellite families.

  • Declaration Due Date is March 31.

  • All owners on title must complete a declaration, even if they are spouses.

  • Areas covered include the Capital Regional District (Victoria and surrounding areas), Metro Vancouver Regional District (including Lions Bay and Squamish), Langley, Abbotsford, Mission, Chilliwack, Kelowna, West Kelowna, Nanaimo, and Lantzville (use the link to confirm areas).

  • No clauses needed in CPS to protect the buyer.

  • More information: B.C. Speculation and Vacancy Tax

Canadian Underused Housing Tax:
  • Starting in 2023 for the 2022 tax year, there is an annual 1% tax on the taxable value of a vacant or underused residential property that is directly or indirectly owned by a non-resident non-Canadian.

  • CRA filing is required by April 30th.

  • Excluded Owners (Canadian Citizens and permanent residents of Canada) do not have to file, but some exceptions may trigger a requirement to file.

  • This tax applies to all of Canada.

  • No clauses needed in CPS to protect the buyer.

  • More information: Canadian Underused Housing Tax

B.C. 3-Day Home Buyer Rescission Period:
  • Effective January 3, 2023.

  • Affects residential properties other than leasehold, auction, court order, presale.

  • Provides a buyer with a 3-day rescission period starting the day after acceptance, excluding Saturdays, Sundays, and holidays.

  • If a buyer rescinds, they are required to pay the seller a 0.25% penalty, which can be paid from any deposits held in the brokerage trust account or pursued by the seller if no deposits were given.

  • The rescission period cannot be waived.

  • The Contract of Purchase and Sale must contain the exact rescission amount based on the purchase price, the contact for sending rescission notice, the final acceptance date, and the last date rescission can happen.

  • Rescission can be done using the required form by registered mail, fax, or email with a read receipt.

  • More information: B.C. 3-Day Home Buyer Rescission Period

B.C. Foreign Buyer Tax:
  • The tax is 20% for foreign nationals, foreign corporations, or taxable trustees.

  • Applies to the Capital Regional District (Victoria, Saanich, and surrounding areas, Gulf Islands), Fraser Valley Regional District (through to Hope), Metro Vancouver (to Lions Bay), Central Okanagan, and District of Nanaimo.

  • Contact the provincial government for clarification at 1-888-841-0090 or attenq@gov.bc.ca

Canada 2-Year Foreign Buyer Ban:
  • Starting January 1, 2023, non-Canadian citizens and non-permanent residents are prohibited from purchasing residential property in Canada for two years, whether directly or indirectly (meaning buyers not on the contract but acting as a beneficial owner are also prohibited).

  • Agreements signed before January 1, 2023, are not subject to the prohibition.

  • The ban applies to properties in either a "census agglomeration" or a "census metropolitan area," with certain exemptions such as Whistler. You can refer to the following link for more information: link

  • The prohibition applies to residential properties and buildings with up to three dwelling units (multi-family rental buildings). Vacant land is exempt as of March 27, 2023.

  • The ban applies to individuals and corporations with a non-Canadian ownership interest of 3% or more.

  • Some exemptions may apply, and it is advisable to consult the legislation and seek legal advice to determine if they are applicable.

  • Violation of the Act can result in a $10,000 penalty for all parties involved, including the buyer, seller, lawyer/notary, real estate agent and brokerages, lenders, etc. Additionally, a court order may be issued to sell the property, with any profit going to the government.

  • A property may be exempt from the Foreign Buyer Ban but could still be subject to the Foreign Buyer Tax.

  • Buyers should sign the Certificate and Consent of Purchaser form to confirm their eligibility to purchase.

  • The Canada Mortgage and Housing Corporation (CMHC) provides comprehensive information on the ban, including a feature to look up an address and determine if it is exempt. You can find more information at the following link: link

Anti-Flipping Rule:
  • The anti-flipping rule is applicable nationwide and is based on Canada Revenue Agency (CRA) filing requirements.

  • Any individual who sells a property within a period of less than 12 months would be considered to be flipping the property and subject to full taxation on their profits as business income.

  • Some exemptions exist, and it is advisable to seek advice from an accountant to understand the specific details and implications.

  • Assignments are currently exempt – that could change.

Read

Sales and Listing Report for May 2023

Highlights

  • May average home price $200,000 higher than in January

  • May home sales-to-listing ratio a sizzling 59%

  • Total sales are the highest this year and higher than in May 2022

  • Surrey detached new listings were up 53% from April 2023

  • Overall higher listings may point to a price plateau this summer 

After five months that defied most predictions and pundits, the Metro Vancouver housing market has righted itself - as we’ve been saying the last few months, while quickly shifting to a seller’s market. But the potential is there to be more balanced between buyers and sellers as we sail into the summer.

May exposed a slight tilt in that balance in favour of buyers, with sellers about to face a more competitive environment with the increase in new listings that happened in May. And depending on what happens with the Bank of Canada’s interest rate announcement on Wednesday, that could change some buyers’ ability to compete.

Back in January and before – when the headlines were full of predictions of a recession and a continued housing downturn - we urged homebuyers to jump into the market to take advantage of the dip. Since then, the average home price in Greater Vancouver has shot up by $200,000 and the sales-to-listing ratio has risen from 29% to 61% in April before settling to 59% in May, close to the hottest markets in 2021 and early 2022.

We based our forecast not only on the strength of the regional economy but on decades of experience as real estate professionals at Dexter Realty. We have seen deep downturns and heady highs before, so we understand the patterns and how quickly it can change. 

While May 2023 marked the fifth straight month-over-month increase in sale and price, it also sent the first signals of a chance for a market shift.

While we are still in a seller’s market in most areas and property types, if the increase in new listings continues, this will favour buyers. And perhaps some buyers are waiting for the June 7 Bank of Canada announcement, which could affect mortgage rates.

The evidence is in the number of sales and listings in May, and when they occurred. It is all about momentum.

In May 2023 a total of 3,411 residential properties sold in Greater Vancouver, not only the highest sales of this year but the first month in 2023 that sales were higher than the same time a year earlier and the first time this trend occurred in the last few years. 

The average (not benchmark) home price in May reached $1,315,617, the highest level since April 2022 and up nearly 3 per cent from May of 2022.  

This would all point to a seller’s market, except that, unlike previous months this year, May sales were slightly lower in the second half of the month compared to the previous two-week period to start May. At the same time, new listings increased, rising from 2,909 at mid-month to 5,776 at month’s end, compared to 4,399 in April 2023. May tends to be the most active month of the spring market, so we could see that shift come June. 

In the Fraser Valley, new listings in May, at 3,533, were 42% higher than in April (with detached listings up a startling 61%) while sales increased just 10% month-over-month to 1,711. 

So, as May ended, we were seeing parallel momentums: many more listings and perhaps the peak of sales.

While the last few months have been characterized by multiple offers and increasing prices, we will now see more competition among sellers. It will take many more listings to ease the competition amongst buyers but May was a start.

With the increase in listings comes some great opportunities for buyers. Work with an experienced REALTOR® who can sniff out the right property that’s gone under the radar. This isn’t 2021 when prices went wild. There is now a sense of control, and, for some properties, buyers are not willing to compete or take on the price that sellers are asking. 

Buyers must practice patience now, which is difficult after months of low inventory. We are going to see listings increase, the sales-to-listing ratio settling down and more competitive pricing offered by sellers. In short, hopefully we’ll see some balance come into the market for the first time in in three years. 

Of course, all real estate markets are unique, and not all will follow the same trajectory immediately.

There were 9,293 active listings at month end, above the 8,790 at the end of April. Yet some areas had fewer active listings in May than a month earlier, so it’s important to look locally when doing direct comparisons. 

Vancouver East saw a slight uptick in the sales-to-listings ratio while North Vancouver maintained its high rate at 66%. Both locations were called out by the provincial government for not doing enough to supply housing in its recently released list of the municipalities that aren’t building enough homes. Port Moody, on the heels of less sales in May compared to April, saw its absorption rate fall from 91% to 65%.  

Ladner led the way in May with a 108% sales-to-listings ratio as there were more sales than new listings there. Not surprising, Delta was also cited by the province for not supplying enough homes. 

Overall Greater Vancouver remains with 3-months’ supply of listings – and with the current number of sales we’d need to double the number of active listings to get into a truly balanced market, but listings are finally increasing.

Best advice to buyers: Work with your trusted REALTOR®, get pre-approved for financing, narrow your search and be ready when your agent finds that ideal property. Do your homework and keep within your budget. 

Best advice to sellers: Prices have risen 1.5% per month this year, but do not expect that to be automatic. A property priced right will attract a slew of potential buyers (it is not uncommon to see 40 people through a weekend open house) but if it is priced above the market or not showhouse ready, buyers now have the option to move on to the next new listings.

 A summary of the regional markets 

Greater Vancouver: A total of 3,411 residential properties sold in May, up 24% from a month earlier and, for the first time this year, higher than in the same month in 2022, when 2,947 transactions were counted. The surge in prices surprised us all, even the Real Estate Board of Greater Vancouver (REBGV). “Back in January, few people would have predicted prices to be up as much as they are – ourselves included,” Andrew Lis, REBGV’s director of economics and data analytics said. “Our forecast projected prices to be up by about 2% at year-end. Instead, home prices are already up about 6% or more across all home types.”

As of May 23, the composite benchmark price was $1,118,000, up 1.3% from a month earlier; the detached house price was up 1.8% to $ $1,953,600. While townhouse prices remained virtually the same as in April, at just over $1 million, condo apartment prices were up 1.1% month to month to $760,800.

Active Listings were at 9,293 at month end compared to 8,790 at the end of April; new listings in May were up 31% compared to April 2023. Month’s supply of total residential listings is steady at 3 month’s supply (seller’s market conditions) and sales to listings ratio of 59% compared to 62% in April 2022 and 45% in May 2022.

 Fraser Valley:  Total Valley sales reached 1,711 in May 2023, up 25% from May 2022 and 10% higher than in April 2023. With new listings up 42% from April, there were total active listings of 5,588 at the end of May, 20% higher than a month before. The benchmark composite home price in May was $961,702, up 6.7% from April 2023 and 3% higher than in May 2022.  

Vancouver Westside: Metro’s bellwether housing market saw 624 sales in May, up 33% from a month earlier and 7% higher than in May 2022. The May 2023 benchmark detached house price has increased 5.7% (or $193,000) in the past six months and took another 0.5% step up from April to $3,338,800. Townhouses sold for $1,457,500, down 3% from April, and condo apartments sold in May 2023 at a benchmark of $849,800, up 4.8% over the last three months. Active listings were 2,115 at month end compared to 2,460 at that time last year and 1,992 at the end of April, but new listings in May were up 40% compared to April 2023. With a 3-month supply of total residential listings, the sales-to- listings ratio is a healthy 53% compared to 56% in April 2023 and 46% in May 2022. 

Vancouver East Side: Vancouver is one of the cities named as needing to increase new home starts and it is easy to understand, since East Vancouver, like the Westside, also has just a 3-month supply and a sales-to-listing ratio above 50%. The problem is new homes are more expensive, largely because of government fees and taxes, which have increased sharply. A recent study showed a typical new $840,000 condo apartment in Vancouver includes $327,565 in government costs. An Eastside resale condo had a benchmark price of $707,000 in May, up 1.9% from a month earlier, while townhouses were at $1,109,100, the same as in April, and detached houses sold in May for at a benchmark of $1,822,700, up 2.5% from a month before. Total May sales were 360, up 35% from a month earlier and 13% higher than in May 2022. Active Listings were at 1,006 at month end compared to 1,173 at that time last year and 939 at the end of April. This is a full-on seller’s market.

North Vancouver: Total housing sales in May were 288, up 32% from a month earlier and 3% above May 2022. The composite benchmark home price is $1,397,500, up 5.5% from six months ago and 1.8% higher than in April 2023. While new listings increased 32% from April, total active listings were 514 at the end of May, representing just a 2-months’ supply of housing, with townhouses down to a 1-month inventory. The sales-to-listing ratio has held steady at 66% for two months. The benchmark price for a detached house is now just 4% below May 2022, and, at $2,269.400, the highest level this year.

West Vancouver: The benchmark price of a detached house in West Vancouver in May was nearly unchanged from six months ago, at $3,111,600. Total housing sales, mostly detached houses, were 80 in May, up 16% from April 2023 and 16% higher than in May 2022. With 529 total active listings, there is a 7-month supply in a balanced market where the sales-to-listing ratio is 35%.

Richmond: Two large strata projects in Richmond totaling 1,200 units have been cancelled, the latest the 400-condo Minora Square on May 26, where pre-sale buyer deposits are being refunded. Perhaps a resale condo is a safer bet, since Richmond has also raised new condo development cost charges to around $25 per square foot. In May, a total of 396 homes sold in Richmond, leaving a total inventory of 1,043 properties (a drop from 1,602 at the end of April), or about a 3-month supply, with a 61% sales-to-listing ratio. Prices are rising sharply. The benchmark detached house price is up 7.7% since December 2022, at $2,189,600; and the benchmark condo price in the same period is up 9.6% to $747,00. Townhouse prices are 0.2% higher than a year ago, at $1,119,900.

Burnaby East: Burnaby East saw 39 home sales in May, up from both April 2023 and May 2022 and it now has 90 active listings. With a sales ratio of 57%, the benchmark home price is up 4% since the start of the year, at $1,159,600. This is a seller’s market with just a 2-month supply of homes on the market.

Burnaby North: Burnaby has the most new housing in the works across the region, with a total of 10,630 new strata units envisioned in four massive projects from Brentwood to the Edmonds area, according to an open house May 30 at Burnaby City Hall. All four sites require rezoning. However, Burnaby also wants to increase development fees to help cover the cost of an extended array of infrastructure, including firehalls, RCMP police stations, homeless shelters and “composting and organic processing facilities,” which will add to new strata prices. The new homes are needed. Burnaby North has just a 2-month supply of active listings and they are selling at a pace of 63% per month. The benchmark condo price is now $805,800 and townhouses sell for $902,200, both up about 6% from the first of this year. 

Burnaby South: Total units sold in May were 233, up 8% from a month earlier and 43% higher than in May 2022. The benchmark composite home price is up 5.5% since January 1, at $1,112,300; and detached house prices are up 8% in the same period to $2,177,100, the highest in Burnaby. New listings in May were up 20% compared to April 2023 but down 7% compared to May 2022. The supply of total residential listings, at 404, is steady at a 2 month’s supply (seller’s market conditions) with a sales-to-listings ratio of 73%. 

New Westminster: The benchmark price for a detached house in the Royal City was $1,525,800 in May, up 5% from the start of 2023, but the overall composite price remains among the lowest in Metro, at $827,600. A total of 142 residential properties sold in May, 26% higher than a month earlier and up 27% from May 2022.  Active Listings were at 258 at month end compared to 313 at that time last year and 238 at the end of April. This is about a 2-month supply as the sales-to-new-listing ratio has been running at 70% in both May and April. 

Coquitlam: Total May sales reached 284, up 35% from April 2023 and 16% higher compared to May 2022. Active Listings were at 555 at month end compared to 642 at that time last year and 495 at the end of April; new listings in May were up 38% compared to April 2023, perhaps because sellers see what is happening. The benchmark home price has increased 4.7% so far this year to $1,114,900 and the sales-to-listing ratio has been over 60% for four months. This is a strong seller’s market.

Port Moody: This Tri-City community has a history of slow development, and it is on the list of cities where the province wants to see more housing starts. Port Moody now charges $33,453 per detached or duplex lot in development fees and tacks from $11 to $14 per square onto new strata units, so that will add to new home prices. Right now there is just a 2-month supply with only 184 active listings. Benchmark home prices are still 9% below May 2022, at $1,112,300. The sales to listing ratio, though, was 65% in May and 91% in April, so supply could disappear quickly. 

Port Coquitlam: Total units sold in May were 91, up from 76 in April 2023 and the very same at in May 2022, but the composite benchmark home price is down 6.9% year-over-year, at $951,800. Detached houses were benchmarked in May at $1,392,100, up 8.5% from January 1, but still 8% lower than a year ago. While new listings in May were up 89% from April 2023, there are only 153 active listings, enough to last about two months, with a sales-to-listing ratio running at 62%.

Pitt Meadows: Just 30 homes sold in May, but that was 44% better than April 2023 and higher than the 28 sales in May 2022. Detached home prices, while lower than last year, have soared 10% from the start of this year to a 2023 high of $1,274,800 in May. Active Listings were at 71 at month end compared to 84 at that time last year and at the end of April; New Listings in May were down 17% compared to April 2023 and the hot sales-to-listings ratio of 86% shows the current supply may not last long.

Maple Ridge: With 218 sales in May, total transactions were up 35% from a month earlier and 23% higher than in May 2022. The benchmark detached house price has increased 7.6% over the past three months to $1,261,700, with townhouse prices up to $768,100 after a 2.4% increase from a month earlier. The post-COVID slump in Maple Ridge appears over, with a sales-to-listing ratio in May of 63% and 62% in April in what has become a seller’s market with 539 active listings available.

Ladner: Delta is another of the Metro region cities called out by the province for not building enough new homes. Ladner, for example, only has 85 active listings (down from 100 at the end of April) and the May sales-to-new-listing ratio was 108% and new listings were down 14% from April 2023, while sales increased 26% to 54 transactions. The benchmark home price in Ladner is up 7.2% since the start of the year, at $1,144,200. There were more strata sales than new listings in May, which saw townhouse benchmark prices rise 10.4% so far this year to $973,800. Condo benchmark prices are at $704,800 in May, up less than 2% since January, however. 

Tsawwassen: Total units sold in May were 62 up 15% compared to April 2023, up 44% higher than in May 2022. Active listings were steady at 166 at month end compared to 165 at that time last year and 167 at the end of April; New Listings in May were up 23% compared to April 2023. Total residential listings are at a 3 month’s supply (seller’s market conditions) and the sales to listings ratio of 68% compares to 73% in April 2023. The benchmark home price in May was $1,221,900, up 5.6% from the first of this year but nearly 9% below the price in May 2022. Townhouse sales are particularly slow and the benchmark price of a townhouse, at $1,005,700 in May, has barely budged in two months.

Surrey: B.C.’s second-biggest city saw 855 total sales in May, almost evenly divided among detached, townhouse and condo properties, but there the similarity ends. Detached sales, at 284, were up 44% from a year earlier and 11.4% from April 2023. The average detached price was $1,784,000 in May, up 8% from a month earlier. There were 246 townhouse sales, up 8% from a year earlier and 14% higher than a month earlier, while the average townhouse price was up just 0.3% from April 2023 to $878,396. Condo apartment sales, at 225, were up 1.8% year to year, and 1% month to month, while the average price was up 3.3% from last year and 6.6% from April 2023, at $560,180.

Download May Sales and Listings Statistics All Regional
Download May Sales and Listings Statistics Houses Townhouses Condos
Download Sales & Listings Images

Kevin Skipworth, Partner/Broker and Chief Economist at Dexter Realty

Read

Sales and Listing Report for April 2023

Highlights of the April Market Report

  • We are now in a seller’s market across Greater Vancouver 

  • Multiple offers are being seen as buyers roar back 

  • Buyers must brace for higher new home prices in ‘24

  • Greater Vancouver sales are up 166% since the start of the year

  • Fraser Valley detached house prices are up $60,000 since January

As much of Canada suffers under a belief that the housing market has tanked, Metro Vancouver homebuyers are quietly and efficiently setting month-over-month sale increases this year and are already being rewarded by rising prices.

Consider this a wake-up call.

Total April housing sales across Greater Vancouver hit 2,741 transactions, up from 2,535 in March and a 166% increase from January 2023 and the highest monthly level since May 2022. Benchmark home prices so far this year are up 5%. Based on the current benchmark, that is an increase of nearly $60,000, and prices are still rising by 2.4% a month.

In the Fraser Valley, April sales totalled 1,554 homes, even with a month earlier and up 148% from January of this year. The benchmark detached house price is up $100,000 compared to January and the typical condo sold in April at $503,700, up $30,000 from the start of the year.

This was not foreseen by most; and in April, Canada Mortgage and Housing Corp., the federal housing agency, told us that the Metro Vancouver average home price could fall as much as 24 percent this year and it didn’t see a sales recovery until 2024-25.

On the street, the reality is much different. With the Bank of Canada halting rate increases, buyers are more confident and are back in a big way. The April competition for new listings was astounding: over 20 offers for a detached house in Ladner; 10 to 20 offers for condos throughout the region, including downtown Vancouver among the many anecdotal reports from the field. With a consistent shortage, any townhouse listing attracted multiple buyers, and the sales-to-listing ratio hit a jaw-dropping 185% in April for Port Moody townhouses. 

The real estate market has turned quickly and is fast approaching 3,000 sales a month. If this happens in May, as we suspect, it would be the first time since April last year that Greater Vancouver has achieved that number.

Another signal of the turnaround is new housing starts, which have roared back and may help to alleviate the continued lack of new resale listings. In the first quarter of 2023, 7,318 new homes started in Metro Vancouver, up 69% from the same period last year. The current residential construction pace, if maintained, would result in more than 29,000 starts this year in Metro Vancouver, the highest level in three years. But this will take time to have any effect on the market and will require many more starts.

A big test of the new condo market is now being conducted on the Burnaby-Coquitlam border this month where a brand-new condo tower complex is finished and offered for sale. Normally, new condos are sold as pre-sales, but these 262 apartments at the City of Lougheed are move-in ready. This is a bold and rare test of the condo market and should give a strong indication of current demand. We would not be surprised by a quick sell-out.

However, we are less certain that buyers will be flocking to purchase new homes in 2024 because of startling government-imposed cost increases. Costs keep getting added to the equation and for some developments, it may not be feasible to move from the planning to the building stage. 
 

Here are some of the recent increases homebuilders are now dealing with:

  • On April 19, the Metro Vancouver Regional District board of directors approved a motion to make real estate developers pay 99% of the cost for water and sewage upgrades across the district. Currently, developers pay 83% for sewage upgrades and 50% for water infrastructure, so this is a big increase, especially since three large water-treatment projects are currently underway, totalling well over $10 billion.
     

  • Led by a 47% increase in Richmond and a 33% hike in Coquitlam, suburban municipalities across the region are raising development cost charges on new residential construction going into next year. 
     

  • On May 1, the B.C. Step Code building code for new residential construction was legislated across the province. This ‘green’ building code, the most rigid in Canada, will outlaw natural gas in new buildings and add thousand, even tens of thousands of dollars, to the cost of new homes, especially detached houses, and high-rise concrete condos.
     

  • Changes to B.C.’s contaminated land regulations, just coming in, will add an extra $80,000 to $100,000 in testing alone, and delays to a new strata project before construction even starts
     

  • Residential land prices – and the cost per buildable foot – are soaring right across the Lower Mainland. Recently, residential sites in North Burnaby and Surrey Central sold for more than $25 million per acre; a 1.3-acre land assembly in Coquitlam sold in March for $24.5 million; and Vancouver is seeing residential development land trading at $90 million per acre or more.

Best advice: buy an existing home this year, and the sooner the better. Existing homes can’t be replaced for nearly the same price, and resale values are increasing month-over-month.

 
A look at the regional numbers:

 
Greater Vancouver: Total housing sales in April were 2,741, up 8% from a month earlier and 166% higher than in January of this year and off just 16% from April 2022. By next month, the script will shift as sales begin to be higher compared to a year ago. For true market comparison, April sales this year were 48% higher than in April 2019 before the pandemic hit and everything went crazy. However, listings are the laggard, down 1% this April from a month earlier; and total active listings, at 8,734, represent just a 3-month supply at the current sales pace. The inventory shortfall is leading to multiple offers and rising prices, with April’s benchmark price up 2.4% from a month earlier; detached house prices and condo prices are 3% higher at $1,915,800 and $752,300, respectively. With 500 sales in April, and a high sales-to-listing ratio, townhouse prices were up 2.1% from March to $1,078,400. Greater Vancouver is now a sellers' market in all property types, with an overall sales-to-listing ratio of 62%. 

Fraser Valley: The Fraser Valley Real Estate Board posted 1,554 sales in April, virtually unchanged compared to March 2023 and up 5.1% from April 2022. Listings were down 31% from April 2022 however, to 2,478. There are now 4,632 active listings, down 2.2% from March 2023 and 14% below April of last year. Prices are rising as buyers bid on fewer listings. Detached-house prices, at $1,442,900, were up nearly 4% from March 2023; townhomes increased 1.7% month-over-month to $808,000; and the benchmark condo price was up 1.6% in the same period to $530,200. Strata prices are down from 9% to 13% from a year ago, with detached prices off 17% from April 2022. 
 
Vancouver Westside: 
The Westside saw condos in a seller’s market in April, while townhouses jumped up to 7 month’s supply and the detached-house sector is still in balance. But new listings were 9% lower overall in April compared to March, so buyers are purchasing what they can. In all, 468 sales were recorded in April, nearly 50% higher than in February and up 4% from March 2023.  Prices are rising fast: the benchmark detached house price is now $3,313,200, up 9.7% (about $310,000) since January and up 3% from March. Townhouse prices shot up 6.5%, month-over-month to $1,481,900 and typical apartments sold for $848,000 in April, an increase of 2.5% from March.  The supply of total residential listings is steady at a tight 4-months in this seller’s market. April’s sales-to-listings ratio of 56% compared to 49% in March 2023 and 48% in April 2022.
 
Vancouver East Side: Compared to a year ago, East Side sales and listings were down sharply from a year ago, but sales were also lower than in March 2023, with 267 transactions in April compared to 287 a month earlier. There were 939 active listings as of April 30, up from 899 at the end of March. The total inventory represents a 4-months’ supply as the sales-to-listing ratio is a strong 55% in this seller’s market.  The median price of the 75 houses sold in April was $1.95 million, up nearly $150,000 from a month earlier. Condos led the sales parade, with 113 sales at a median of $657,000, up marginally from March, while median townhouse prices increased to $1,405,000, up about $50,000 from April of last year. Over the past three months, the overall benchmark price is 5.4% higher, at $1,312,400.
 
North Vancouver: April sales continued a trajectory that has seen transactions rise 46% over the past two months to reach 218. Benchmark home prices have followed the lead, rising 7% since January to $1,369,900 in April, with detached house prices up nearly 8% in the same period to $2,192,200. Despite new listings falling 10% from March, total active listings at the end of April were 495, nearly identical to a year earlier. We estimate there is a mere 2-month supply of total listings, with the sales-to-listing ratio running at 66%, up from 58% from both a month and a year earlier. This is a seller’s market that is gaining momentum.

West Vancouver: Metro’s second-most expensive housing market is not known for a high number of sales and April was no exception, with 60 transactions, down 6% from a month earlier, though 43% higher than in February. New listings, though, were 94% higher than a year ago, so the market is stirring. We are calling this a balanced market, but shifting to a buyer’s advantage for those who can afford it. The benchmark price of a detached house, which dominated the market with 43 sales in April, is $3,111,600, up 3% from March, but still 8% lower than a year ago. The overall sales-to-listing ratio is 38% and has held steady in that range for two months.

Richmond: The ban on foreign homebuyers that came into effect on January 1 apparently had zero effect in Richmond, despite some concerns. Sales are following similar patterns to other markets, with 338 transactions in April up 51% from February and well above January. Prices are also firming in Richmond: the benchmark price is $1,179,200, down just 1.7% from a year ago and rising an average of 2% per month since the start of the year. Active listings were at 1,062 at month-end compared to 1,197 at that time last year and 1,049 at the end of March. This is a seller’s market, with the sales-to-listing ratio in April at 67%, which compares to some of the best months of early 2022, and there is just 3-months’ supply of inventory. Housing starts are rising, however, with 507 new homes breaking ground in March, up from just 62 in March 2022 – nearly all the new starts are multi-family units, including 37 new townhouses. So many more townhouses are needed.

Burnaby East: Total sales in April were just 34, but that was up 70% from a month earlier and just 6 units lower than in April of last year. The benchmark price rose 0.4% from March, to $1,114,900, while the detached house price increased 1.3% to $1,749,700, still the lowest in Burnaby.  Active listings were 76 at month-end compared to 67 at that time last year and 85 at the end of March. The inventory of total residential listings is down to 2-month supply. This is a seller’s market on steroids, with a sales-to-listings ratio of 81% compared to 43% in March 2023 and 58% in April 2022.

Burnaby North: This is one of the hot markets where total sales in April, at 176, were higher than in April 2022, in this case, up 7 percent year over year and 4% higher than in March 2023, and 31% above February of this year. Condos led this market, and the benchmark condo price has increased 5.5% over the past three months to $734,600. Confidence in the future strata market was underlined in April when a major condo developer paid $94 million for a 4.2-acre development site near the Brentwood and Gilmour SkyTrain station. There was a total of 415 residential properties for sale at the end of April, slightly higher than a year earlier and up from 388 in March. The benchmark home price is up 5% since January, at $1,002,900.

With a sales success ratio of 67%, compared to 71% in March 2023 and 47% in April 2022, this is a strong seller’s market.

Burnaby South: Sales here were also up from a year ago, rising 16% to 215 this April, which was also 65% higher than in March 2023. At $1,100,200, the benchmark price in April was up 2.3% from a month earlier. The benchmark detached house price has surged nearly 8% higher since January, to $2,145,800. In an unabashed sellers’ market, the sales-to-listing ratio is a sizzling 81% and the total inventory, at 385, represents just a 2-month supply.

New Westminster: Total April sales were 113, up from 96 (18%) in March 2023 but down from 134 (16%) in April 2022. We see the Royal City as a good buy this year. The benchmark detached house price in April was $1,433,100, up just 0.2% from a month earlier and down 4.3% from a year earlier. But this house price is about $300,000 less than Coquitlam or East Burnaby. New West condo prices, at $652,100, are also among the lowest in the suburbs. We have a feeling New Westminster has price growth potential. Total active listings are 238, down from last April but up 15% from March 2023. With a sales-to-listing ratio of 70%, this is a seller’s market, but buyers may find the prices tempting. 

Coquitlam: Many will be watching a rare event when two new condo towers, finished, launch more than 200 units into the market in May. The towers are technically in Burnaby but right on the Coquitlam border at Lougheed Town Centre. In April, 99 Coquitlam condo apartments sold at a median price of $685,000 and there were just 149 new listings, generating a healthy 67% sales-to-listing ratio. Total active listings of all properties were at 495 at the end of April, compared to 572 at that time last year and 473 at the end of March.

This is a seller’s market that appears to be accelerating. 

Port Moody: The entire Tri-Cities region has seen only 74 housing starts so far this year, so we must look to resale listings for future supply, and that means a tight inventory due to high demand in Port Moody. Port Moody might be the hottest market in Greater Vancouver, with a 91% absorption rate overall, sitting with 2-month supply. Townhouses saw a jaw-dropping 185% absorption rate, meaning almost two sales for every new listing. Condo sales were up 73% year-over-year in Port Moody as condo prices dipped to a median of $685,000, down from a median of $712,500 a year earlier. Total sales in April were 91, up 14% in March and 94% higher than in February in this active seller’s market.

Port Coquitlam: With 76 sales in April, transactions were up 10% from a month earlier, but new listings dropped 39% month-over-month while the composite home price inched up 1.2% to $927,100, the lowest in the Tri-Cities. Detached house prices are now 13.3% below April of last year but are rising by around 2.2% per month. With only a 2-month supply of listings and a sales-to-listing ratio at 97%, compared to 54% a month earlier, this is a clear seller’s market.

Ladner: There is only 1 month's supply of townhouses and condos, with only 7 condo new listings in April compared to 19 in March in Ladner. The overall sales-to-listing ratio is 74%.
Townhouse benchmark prices dipped 0.7% in April from a month earlier, but remain 7% higher than in January, at $991,700. Condos are selling at $698,000, but prices were down 2% in April from March 2023. With just a 2-month supply of listings and a sales ratio of 74%, we expect prices to increase in this seller’s market. 

Tsawwassen: Sunny Tsawwassen has an example of what is known as an intergenerational community, the Southlands development, which took years to win approval but could be a template for future suburban projects. Its mix of housing is designed to attract seniors and young families with an agricultural theme and a lively retail village that includes a beachfront. It is among the reasons Tsawwassen is seeing higher sales now than a year ago and where total home sales have more than doubled since February. The townhouse’s benchmark prices are $901,600, lower than in neighbouring Ladner. Detached-house prices in April were up 7.2% from a month earlier, at $1,473,200, but remain 14% lower than a year ago. Condo apartments, at $724,900, are nearly unchanged from last year. A total of 54 properties were sold and there are only 167 on the market. With a sales-to-listing ratio of 73%, the highest for an April in years, this is a sellers’ market with very low inventory.

Pitt Meadows: Total sales have been declining for more than a year and April was no exception with just 27 transactions, down 4% from a month earlier and 40% lower than in April 2022. Detached house prices remain 17% lower than a year ago but have rallied so far this year, up 7% to an April benchmark of $1,220,900.  New listings in April were up 26% compared to March 2023, bringing the overall supply to about 3 months. With a sales-to-listings ratio of 50%, compared to 65% in March 2023, this is a weak seller’s market that could be balanced.

Maple Ridge: Young families looking for a townhouse are often drawn to Maple Ridge, where there is a fairly good selection and benchmark prices are down 15% from April 2022, to $747,200. This is about $200,000 below the Lower Mainland benchmark. Townhouse prices are inching up, though, increasing about 6% so far this year. Total property sales in April reached 161 in April, 8% higher than in March and just 3% below April 2022. This seller’s market is firming, with new listings in April down 7% from a month earlier, a sales-to-new-listing ratio of 62% and just 506 homes on the market. 

Surrey: The Fraser Valley’s largest market saw just 255 detached sales, 216 townhouse transactions and 227 condo sales in April, with detached and condo sales up 4% from March and townhouse sales down 3%. Detached house prices were up 3.8% month over month, but down 16% from a year earlier, at $1,579,100. The lowest strata benchmark prices are in North Surrey, with townhouses at $749,700 and condo apartments at $497,800.

Download April Sales and Listings Statistics Houses Townhouses Condos
Download April Sales and Listings Statistics All Regional
Download Sales & Listings Images

Kevin Skipworth, Partner/Broker and Chief Economist at Dexter Realty

Read

Sales and Listing Report for Mid-April 2023

April is showing improvements from March as we see sales and listings on a slow but steady increase, although dramatic changes in market activity aren’t likely month over month as we settle into a balanced market that has dressed up as a seller’s market. With active listing counts flirting with decreases in some areas and product types and slight increases in others, and as buyer activity increases, competition over those too few listings have increased thus shifting the advantage back into sellers’ hands in some cases.

At the mid-point of April, there have been 1,227 sales in Greater Vancouver, more than the 1,184 that sold at the mid-point of March, and much more than the 878 that had sold at the mid-point of February. Even looking at 2019 as we have, there were only 856 sales at the mid-point of April in that year. The comparison to that year and any year for that matter seems to be less meaningful. This is a market onto its own. With Easter having taken some steam out of the market, buyers are more active this month than last and with the last half of the month not impacted by spring break as March was, we can expect sales to accelerate through the remainder of April. We’re already seeing this as the daily sales reported by the Greater Vancouver’s Board are higher in the first two weeks of April compared to March. And with the Bank of Canada holding their rate last week, buyers have some certainty in interest rates for the foreseeable future.

At mid-month in Greater Vancouver there have been 2,182 new listings so far, just slightly above the 2,154 new listings at the mid-point of March and not much more than the 1,846 new listings at the mid-point in February. This is of course still far below the 3,202 new listings at the midpoint of April 2022 or 4,078 new listings at the mid-point of April 2021. And looking at the comparison to 2019, it’s even much lower than the 2,819 new listings at the mid-point of April in that year. Listing inventory continues to be a challenge for buyers to find in our market.

Some interesting side notes so far this month. Vancouver’s West Side thus far has seen less new listings at mid-month compared to March, while the East Side has seen greater new listings and less sales, creating more growth in active listings. North Vancouver perhaps waiting to get through spring break and Easter has seen less sales and new listings thus far compared to the mid-point of March. In Richmond while sales are slower in April compared to March so far, it is almost double the number of mid-April 2019. Townhouses are the strongest part of that market with active listing counts dropping. Burnaby East has seen almost as many sales so far as all of March, and Burnaby South has also seen a significant jump, showing three times the number of sales as April 2019 at mid-month. Port Moody has seen more sales than new listings so far in April, with a 110% absorption rate. Those new developments can’t happen quick enough there, especially townhouses where there have only been 3 new listings so far to go with 17 sales which has dropped active listings down to 13 there. Moving further east, inventory in Maple Ridge is dropping, especially for townhouses where active listings are down 40% year-over-year. Maybe this missing middle theme has some truth to it.

The low number of active listings continues to be as consistent and the cold, wet weather in Metro Vancouver. With an absorption rate of 56%, which is just higher than we saw in March at 55% mid-month, more new listings are selling than the previous month. And it’s right at where absorption was last April when we saw 56% of listings purchased that month mid-way through. With 8,778 active listings in Greater Vancouver, it’s just above the 8,515 that were available at this time last year when the market was beginning its turn from super heated to super conservative. And while its higher than the 8,395 at mid-month in March, it was believed we would start to see quicker growth in active listings as the spring market moved into full bloom. Here’s hoping spring truly comes to Metro Vancouver in the real estate market as well as with our weather.

Here’s a summary of the numbers:

Greater Vancouver

1,227 units sold so far in April 2023 compared to

1,184 units sold at mid-month in March 2023
878 units sold at mid-month in February 2023
1,797 units sold at mid-month in April 2022
2,402 units sold at mid-month in April 2021
564 units sold at mid-month in April 2020
856 units sold at mid-month in April 2019

2,182 new listings so far in April compared to

2,154 new listings at mid-month in March 2023
1,846 new listings at mid-month in February 2023 
3,202 new listings at mid-month in April 2022
4,078 new listings at mid-month in April 2021
1,105 new listings at mid-month in April 2020
2,819 new listings at mid-month in April 2019

Total active listings are at 8,778 compared to 8,515 at mid-month in April 2022, and 8,395 at mid-month in March 2023.
Sales to listings ratio is at 56% compared to 56% at mid-month in April 2022 and 55% at mid-month in March 2023.

Vancouver West 

215 units sold so far in April 2023 compared to

211 units sold at mid-month in March 2023 
143 units sold at mid-month in February 2023
334 units sold at mid-month in April 2022
402 units sold at mid-month in April 2021
96 units sold at mid-month in April 2020
154 units sold at mid-month in April 2019

420 new listings so far in April compared to

467 new listings at mid-month in March 2023
354 new listings at mid-month in February 2023 
639 new listings at mid-month in April 2022
767 new listings at mid-month in April 2021
196 new listings at mid-month in April 2020
568 new listings at mid-month in April 2019

Total active listings are at 1,988 compared to 2,155 at mid-month in April 2022, and 1,949 at mid-month in March 2023.
Sales to listings ratio is at 51% compared to 52% at mid-month in April 2022 and 45% at mid-month in March 2023.

Vancouver East

111 units sold so far in April 2023 compared to

127 units sold at mid-month in March 2023 
95 units sold at mid-month in February 2023
186 units sold at mid-month in April 2022
263 units sold at mid-month in April 2021
58 units sold at mid-month in April 2020
94 units sold at mid-month in April 2019

251 new listings so far in April compared to

223 new listings at mid-month in March 2023
189 new listings at mid-month in February 2023 
331 new listings at mid-month in April 2022
537 new listings at mid-month in April 2021
124 new listings at mid-month in April 2020
301 new listings at mid-month in April 2019

Total active listings are at 940 compared to 1,174 at mid-month in April 2022, and 903 at mid-month in March 2023.
Sales to listings ratio is at 44% compared to 56% at mid-month in April 2022 and 57% at mid-month in March 2023.

North Vancouver

90 units sold so far in April 2023 compared to

108 units sold at mid-month in March 2023 
68 units sold at mid-month in February 2023
150 units sold at mid-month in April 2022
232 units sold at mid-month in April 2021
50 units sold at mid-month in April 2020
71 units sold at mid-month in April 2019

153 new listings so far in April compared to

180 new listings at mid-month in March 2023
123 new listings at mid-month in February 2023 
231 new listings at mid-month in April 2022
338 new listings at mid-month in April 2021
89 new listings at mid-month in April 2020
273 new listings at mid-month in April 2019

Total active listings are at 496 compared to 455 at mid-month in April 2022, and 455 at mid-month in March 2023.
Sales to listings ratio is at 59% compared to 65% at mid-month in April 2022 and 60% at mid-month in March 2023.

West Vancouver 

34 units sold so far in April 2023 compared to

29 units sold at mid-month in March 2023 
22 units sold at mid-month in February 2023
25 units sold at mid-month in April 2022
54 units sold at mid-month in April 2021
13 units sold at mid-month in April 2020
27 units sold at mid-month in April 2019

94 new listings so far in April compared to

77 new listings at mid-month in March 2023
84 new listings at mid-month in February 2023 
104 new listings at mid-month in April 2022
147 new listings at mid-month in April 2021
43 new listings at mid-month in April 2020
119 new listings at mid-month in April 2019

Total active listings are at 475 compared to 457 at mid-month in April 2022, and 447 at mid-month in March 2023.
Sales to listings ratio is at 36% compared to 24% at mid-month in April 2022 and 38% at mid-month in March 2023.

Richmond

153 units sold so far in April 2023 compared to

163 units sold at mid-month in March 2023 
102 units sold at mid-month in February 2023
234 units sold at mid-month in April 2022
318 units sold at mid-month in April 2021
78 units sold at mid-month in April 2020
80 units sold at mid-month in April 2019

261 new listings so far in April compared to

264 new listings at mid-month in March 2023
255 new listings at mid-month in February 2023 
433 new listings at mid-month in April 2022
513 new listings at mid-month in April 2021
109 new listings at mid-month in April 2020
367 new listings at mid-month in April 2019

Total active listings are at 1,080 compared to 1,149 at mid-month in April 2022, and 1,057 at mid-month in March 2023.
Sales to listings ratio is at 59% compared to 54% at mid-month in April 2022 and 62% at mid-month in March 2023.

Burnaby East 

19 units sold so far in April 2023 compared to

10 units sold at mid-month in March 2023 
7 units sold at mid-month in February 2023
19 units sold at mid-month in April 2022
26 units sold at mid-month in April 2021
7 units sold at mid-month in April 2020
10 units sold at mid-month in April 2019

18 new listings so far in April compared to

22 new listings at mid-month in March 2023
12 new listings at mid-month in February 2023 
39 new listings at mid-month in April 2022
53 new listings at mid-month in April 2021
16 new listings at mid-month in April 2020
25 new listings at mid-month in April 2019

Total active listings are at 77 compared to 70 at mid-month in April 2022, and 77 at mid-month in March 2023.
Sales to listings ratio is at 106% compared to 49% at mid-month in April 2022 and 45% at mid-month in March 2023.

Burnaby North 

77 units sold so far in April 2023 compared to

80 units sold at mid-month in March 2023 
65 units sold at mid-month in February 2023
89 units sold at mid-month in April 2022
146 units sold at mid-month in April 2021
18 units sold at mid-month in April 2020
37 units sold at mid-month in April 2019

129 new listings so far in April compared to

110 new listings at mid-month in March 2023
112 new listings at mid-month in February 2023 
180 new listings at mid-month in April 2022
255 new listings at mid-month in April 2021
56 new listings at mid-month in April 2020
139 new listings at mid-month in April 2019

Total active listings are at 412 compared to 359 at mid-month in April 2022, and 380 at mid-month in March 2023.
Sales to listings ratio is at 60% compared to 49% at mid-month in April 2022 and 73% at mid-month in March 2023.

Burnaby South 

101 units sold so far in April 2023 compared to

60 units sold at mid-month in March 2023
58 units sold at mid-month in February 2023
104 units sold at mid-month in April 2022
126 units sold at mid-month in April 2021
29 units sold at mid-month in April 2020
33 units sold at mid-month in April 2019

125 new listings so far in April compared to
101 new listings at mid-month in March 2023
113 new listings at mid-month in February 2023
181 new listings at mid-month in April 2022
221 new listings at mid-month in April 2021
48 new listings at mid-month in April 2020
141 new listings at mid-month in April 2019

Total active listings are at 390 compared to 425 at mid-month in April 2022, and 387 at mid-month in March 2023.
Sales to listings ratio is at 81% compared to 57% at mid-month in April 2022 and 59% at mid-month in March 2023. 

New Westminster 

54 units sold so far in April 2023 compared to

43 units sold at mid-month in March 2023
30 units sold at mid-month in February 2023
74 units sold at mid-month in April 2022
102 units sold at mid-month in April 2021
37 units sold at mid-month in April 2020
56 units sold at mid-month in April 2019

80 new listings so far in April compared to
77 new listings at mid-month in March 2023
62 new listings at mid-month in February 2023
98 new listings at mid-month in April 2022
153 new listings at mid-month in April 2021
45 new listings at mid-month in April 2020
131 new listings at mid-month in April 2019

Total active listings are at 235 compared to 223 at mid-month in April 2022, and 238 at mid-month in March 2023.
Sales to listings ratio is at 68% compared to 76% at mid-month in April 2022 and 56% at mid-month in March 2023.

Coquitlam

90 units sold so far in April 2023 compared to

97 units sold at mid-month in March 2023
78 units sold at mid-month in February 2023
148 units sold at mid-month in April 2022
159 units sold at mid-month in April 2021
46 units sold at mid-month in April 2020
77 units sold at mid-month in April 2019

180 new listings so far in April compared to

152 new listings at mid-month in March 2023
129 new listings at mid-month in February 2023
263 new listings at mid-month in April 2022
307 new listings at mid-month in April 2021
93 new listings at mid-month in April 2020
213 new listings at mid-month in April 2019

Total active listings are at 506 compared to 547 at mid-month in April 2022, and 469 at mid-month in March 2023.
Sales to listings ratio is at 50% compared to 56% at mid-month in April 2022 and 64% at mid-month in March 2023. 

Port Moody

54 units sold so far in April 2023 compared to

37 units sold at mid-month in March 2023
19 units sold at mid-month in February 2023
35 units sold at mid-month in April 2022
71 units sold at mid-month in April 2021
10 units sold at mid-month in April 2020
25 units sold at mid-month in April 2019

49 new listings so far in April compared to
50 new listings at mid-month in March 2023
49 new listings at mid-month in February 2023
56 new listings at mid-month in April 2022
87 new listings at mid-month in April 2021
28 new listings at mid-month in April 2020
79 new listings at mid-month in April 2019

Total active listings are at 163 compared to 129 at mid-month in April 2022, and 177 at mid-month in March 2023.
Sales to listings ratio is at 110% compared to 63% at mid-month in April 2022 and 74% at mid-month in March 2023.  

Port Coquitlam 

35 units sold so far in April 2023 compared to

28 units sold at mid-month in March 2023
20 units sold at mid-month in February 2023
55 units sold at mid-month in April 2022
83 units sold at mid-month in April 2021
22 units sold at mid-month in April 2020
31 units sold at mid-month in April 2019

52 new listings so far in April compared to

57 new listings at mid-month in March 2023
45 new listings at mid-month in February 2023
101 new listings at mid-month in April 2022
232 new listings at mid-month in April 2021
37 new listings at mid-month in April 2020
80 new listings at mid-month in April 2019

Total active listings are at 159 compared to 168 at mid-month in April 2022, and 150 at mid-month in March 2023.
Sales to listings ratio is at 67% compared to 54% at mid-month in April 2022 and 49% at mid-month in March 2023. 

Ladner 

16 units sold so far in April 2023 compared to

23 units sold at mid-month in March 2023
16 units sold at mid-month in February 2023
17 units sold at mid-month in April 2022
39 units sold at mid-month in April 2021
6 units sold at mid-month in April 2020
15 units sold at mid-month in April 2019

27 new listings so far in April compared to

20 new listings at mid-month in March 2023
35 new listings at mid-month in February 2023
26 new listings at mid-month in April 2022
46 new listings at mid-month in April 2021
17 new listings at mid-month in April 2020
33 new listings at mid-month in April 2019

Total active listings are at 102 compared to 83 at mid-month in April 2022, and 86 at mid-month in March 2023.
Sales to listings ratio is at 59% compared to 65% at mid-month in April 2022 and 115% at mid-month in March 2023. 

Tsawwassen

17 units sold so far in April 2023 compared to

13 units sold at mid-month in March 2023
15 units sold at mid-month in February 2023
23 units sold at mid-month in April 2022
39 units sold at mid-month in April 2021
14 units sold at mid-month in April 2020
9 units sold at mid-month in April 2019

38 new listings so far in April compared to

38 new listings at mid-month in March 2023
23 new listings at mid-month in February 2023
41 new listings at mid-month in April 2022
62 new listings at mid-month in April 2021
20 new listings at mid-month in April 2020
50 new listings at mid-month in April 2019

Total active listings are at 177 compared to 118 at mid-month in April 2022, and 157 at mid-month in March 2023.
Sales to listings ratio is at 45% compared to 56% at mid-month in April 2022 and 34% at mid-month in March 2023.

Download April Sales and Listings Statistics Houses Townhouses Condos
Download April Sales and Listings Statistics All Regional

Kevin Skipworth, Partner/Broker and Chief Economist at Dexter Realty

Read

Sales and Listing Report for March 2023

Highlights of Dexter Realty’s March 2023 Report: 

  • Benchmark prices are 22% higher than three years ago

  • Greater Vancouver sales are up 146% from January 2023

  • Greater Vancouver Benchmark detached-house price rise $60,000+ this year

  • First-time homebuyer incentive starts April 1

  • Five-year fixed mortgages are now the lowest-rate option

  • Fraser Valley home sales soared 72% in a month 

March came in like a tiger and went out like a lion with housing sales doubling over the last two weeks of the month and a total of 2,535 sales up 38% from a month earlier and a startling 146% rebound from the 1,030 transactions in January 2023.

The composite benchmark home price increased by 3% from the end of January.
With the number of listings we have, it is a spring seller’s market with momentum.
In the Fraser Valley, sales in March were 72 percent higher than in February and, at 1,550, total transactions were above the 1,000-unit level for the first time since August of 2022. More surprising is the retreat of active listings, with detached and townhome listings down 20 to 30% year-over-year, even as much as 50% down in some pockets. This has shifted a lot of those markets to 2 to 3 months supply.

Some were surprised at the performance, including most media who are comparing the current market with last year, which is meaningless. The first quarter of 2022 was still in a once-in-a-century pandemic and the Bank of Canada had just started eight straight mortgage rate increases that spooked buyers and sellers alike.

Within the next few months, sales will begin to surpass the same month in 2022 and the headlines and perception of the current sales and price momentum will change.
The Bank of Canada's next interest rate announcement is scheduled for April 12. It’s widely anticipated that the Bank will hold the key overnight rate at 4.5%. Also, after the April break is when lenders tend to come out with their spring mortgage promotions, which should help with the downward pressure on rates.

Fixed-rate mortgage rates are already falling. As of March 30, the lowest rates in Canada were for five-year fixed-rate mortgages at 4.29% for insured mortgages and 4.59% for uninsured home loans, according to a survey by rate.com.

Also, April 1 is the official launch of the new federal Tax-Free-Savings Account for home buyers. It allows a young couple to save up to $80,000 for the down payment on their first home on a tax-free basis. Not a huge incentive but enough to encourage some tenants into ownership. 

The market has changed this spring and you can see and feel it on the street. Buyers who have come back into the Greater Vancouver market already know the score. They are seeing multiple offers on desired properties and benchmark prices that have been rising an average of $15,000 a month so far this year.

Everything is up except listings and even they will not likely stay this low for long as more sellers recognize prices are firming and buyers are back.

March saw 4,317 new listings for residential properties, which was nearly 1,000 more than in either February or January. This was a 35.5% decrease compared to the 6,690 homes listed in March 2022, however, and was 22.3% below the 10-year seasonal average. The overall sales-to-new-listing in March was 57%, which compares to the sales-success ratios during the hot market of 2021. 

The total number of homes listed for sale at the end of March in Greater Vancouver was 8,617, an 8% increase compared to March of last year. Don’t be surprised to see a sudden spike in sellers this spring, since March had the lowest number of new listings for that month since 1995. 

For those who are considering a sale, now is the time to list your property before the rush of new listings begins and competition for buyers increases.

It is resale listings that will deliver the most homes: Metro Vancouver's total non-rental housing starts so far this year are just 700 units higher than in 2022.

Don’t count on the B.C. government's latest ‘Homes for People’ plan to suddenly increase the supply or lead to lower housing prices. The plan, introduced in early April, includes automatic rezoning of every single-family lot in the province to allow up to four housing units. But this has yet to be put into legislation, so at this point, it is just a promise. We’ll have to wait until the fall to see what this may look like and the timing of it being in effect.

The City of Coquitlam has had a similar plan in place for years, allowing fourplexes, smaller lots and laneway houses in most single-detached neighbourhoods in the city since 2011. 

Since then, however, the composite benchmark price of a Coquitlam detached house has increased 143%, compared to an average of 80% in the rest of Greater Vancouver; Coquitlam’s rental vacancy rate is among the lowest, at 0.7%, and the city’s rental rates are the same or higher than anywhere else in the region. Also, Coquitlam is currently sitting with just a 2 months supply of housing, mostly strata units. Clearly, the Metro region has a long way to go in adding supply if progressive Coquitlam can’t even keep up.

The B.C. plan to mandate four-plex density zoning on detached lots will increase the price of a house for rental investors or developers but it won’t deliver more homes people can buy. In the 30-page Homes for People report, strata is never even mentioned. This means house owners who opt into the plan must also become landlords, which many owners have no interest in.

The Homes for People plan is really a ‘houses for rental investors, speculators and tenants.’ This is not a bad thing, but it falls far short of the altruistic hyperbole that always surrounds such government announcements.

Bottom line: We are now at the start of the first normal market in three years. We don’t have ultra-low ‘quantitative easing’ interest rates; the sales-to-listing ratio is becoming balanced; and prices and sales are steadily increasing. All we now need is back-to-normal listings, which, hopefully, we can move toward this spring.

March 2023 report on regional markets:

Greater Vancouver: This is now a near-classic seller’s market. Greater Vancouver is down to a mere 3-month supply of townhouses and apartments available for sale, while detached houses are at a 4-month supply. Something to note: the benchmark composite home price is now 22% higher than it was three years ago when the global pandemic began. Detached sales improved significantly in March, in some areas leading in comparison to last month. While strata units were in seller’s market conditions last month, detached has also shifted to a seller’s advantage, based on current inventory levels. The benchmark price for all residential properties is currently $1,143,900. This represents a 1.8% increase compared to February 2023. The March benchmark detached house price is $1,861,800, up 2.7% – or about $50,000 – from a month earlier. “On the pricing side, the spring market is already on track to outpace our 2023 forecast, which anticipated modest price increases of about 1% to 2% across all product types,” noted Andrew Lis, director of economics and data analytics for the Real Estate Board of Greater Vancouver. 

Fraser Valley: Total housing sales in March posted a 72.6% increase from a month earlier and the 1,550 transactions marked the first-time monthly sales topped 1,000 since August 2022. New listings, at 2,559, were 32% higher than in February, but still 44% below last year, while active listings were up 2.8% over last month. However, listings remain among the lowest March level in a decade. The Fraser Valley Real Estate calls it a week seller’s market, with the overall sales ratio at 31% and townhouse sales-to-listing ratio at 62%. Benchmark prices for detached houses increased 1.9% month-to-month, to $1,390,600. Townhouses were up 2.3% from February, at $794,400; and condo apartments reached $521.800 also, up 2.3% from a month before.

Vancouver Westside: Multiple offers are back in the most-watched market as sales of detached houses in March were the highest since March 2022 and benchmark prices shot up 3.7% from February 2023, to $3,218,500. With 94 sales from 177 listings, the sales ratio was 57% in this seller’s market. Total March residential sales were 449, up 42% from February 2023, and 131% higher than in January 2023. Active listings were at 1,977 at month-end compared to 2,065 at that time last year and 1,923 at the end of February; new listings in March were up 29% compared to February 2023. The supply of total residential assets for sale is down to 4 months and the overall sales-to-listings ratio is 49% compared to 44% in February 2023 as the Westside readies for an active spring.

Vancouver East Side: March sales were 143% higher than in January 2023 and 45% above February 2023, at 287 transactions. With total supply down to 899 properties and new listings up 20% from February, we are calling this a seller’s market. The sales-to-new-listing ratio in March was 62%, compared to 68% a year ago. The benchmark detached house price was up 2.1% from February 2023 and the benchmark price rose 1.7%, month-over-month to $1,135,500. Condo sales led the market in March, with 111 transactions at a median price of 
$665,000.

North Vancouver: New listings didn’t last long in March, with a 72% sales-to-listing ratio and total sales of 215 properties, led by 111 condo apartment sales at a benchmark of $782,800, a price up 2.5% from a month earlier. Townhouses are benchmarked at $1,304,000 with detached houses at $2,141,300, both marginally higher than in February. Total new listings rose 45% from a month earlier, but with sales up 44% month-over-month, a 58% sales-to-listing ratio and prices rising across the board, this remains a strong seller’s market.

West Vancouver: Since the first of this year, 135 homes have sold in West Vancouver and 64 of them sold in March when sales were up 129% from January. But new listings were up just 6% from February and the total inventory of 463 properties represents about a 7-month supply. This buyer’s market is seeking balance with a sales ratio of 39% and the benchmark home price at $1,274,300, up 2.2% from February 2023 but 8% lower than in March 2022. Looking for a deal? West Vancouver’s detached house prices are down 9% from a year ago, at $3,019,500.

Richmond: Richmond posted the largest month-over-month house price increase in the region, with March detached house prices up 6.6% from February to $2,108,100. Total sales were also much higher, rocketing up 55% from a month earlier. Detached sales were up 50% at 95 transactions. Richmond is a seller’s market on steroids, with a sales-to-new-listing ratio of 74%, compared to 49% in February and 63% in March of last year, and total inventory is down to three months.

Burnaby East: Modest increases in home sales, up 5% from February to just 20 transactions in March, compared to a 135% increase in listings would normally signal a buyer’s market. But with just a two-month supply of total active listings and a 43% sales-to-listing ratio, we are calling this to the seller’s advantage. The benchmark home price in March was $1,156,600, up 2.2% from a month earlier but down more than 10% from the same month last year.

Burnaby North: Detached house prices edged up 2% from February to $1,878,200 in March, the highest increase in Burnaby but still 10% below March 2022. Townhouse and condo prices were virtually unchanged from February 2023. This is a seller’s market with a sales-to-new-listing ratio of 71% and just a two-month supply on the market. There are 388 active listings on the market, with new listings up 17% from February 2023. Total sales in March tallied 169 transactions, the highest level so far this year.

Burnaby South: Total sales have been rising month-over-month in the first quarter and reached 130 in March, at a benchmark home price of $1,075,100. This remains a seller’s market, though sales are still down 40% from a year ago and prices are 8.5% lower.  Active listings were 408 at month-end compared to 395 at that time last year and 377 at the end of February. Total listings are steady at 3 month’s supply and the sales-to-listings ratio of 55% compares to 57% in February 2023 and 59% in March 2022.

New Westminster: There is a wide price spread for condo apartments in New Westminster, where the condo benchmark price is $648,000. Dig down and you will find the median condo price varies from a low of $455,000 in the West End of the Royal City to $522,000 in the uptown and peaked at $885,000 in Queensborough, based on March sales stats. That is why it is a good idea to have a knowledgeable real estate agent to guide you if you are a new buyer in historic New West. The overall market is active, with total sales of 96 in March, which was 140% higher than in January 2023 and up 46% from February. This is a seller’s market still, with a sales-to-listing ratio of 68% and just 229 properties on the market.

Coquitlam: As noted above, Coquitlam was a pioneer in up-zoning detached homes to create more housing units per lot, which the city started in 2011, and the BC government now wants to mandate across the province. The rather unsettling result is that, 12 years later, Coquitlam has only a 2-month supply of homes with just 428 on the market as of the end of March. And sales are increasing, with March transactions rising 24% from a month earlier and up 169% since January, to 196.
The benchmark price is up 2% from the start of the first quarter, at $1,065,800. This is a seller’s market, with a 64% sales-to-listing ratio, which is higher than in March 2022, and prices rising for all property types. 

Port Moody: The first master-planned residential community approved and moving forward since 2004 is now pre-selling in Port Moody. The 23-acre, $1.1 billion Portwood development, by Edgar Development, includes 2,000 strata homes and about 470 rentals in the Woodland Park area. The new homes are badly needed as other new projects remain stalled and there is barely a 2-month supply of resales on the market. With total sales of 80 in March, up 70% from a month earlier, the benchmark price is up 2.4% so far this year to $1,105,200 and detached houses are selling at a benchmark of $2,107,400, up 2.4% from a month earlier. The sales-to-listing ratio is high at 70%, nearly the same as a year ago. (Incidentally, the cost for the developer to deliver Portwood included $2.85 million in public art; $30 million for a new road; 328 low-rent housing units for BC Housing, and donating 70% of the land for green space. 

Port Coquitlam: Like Coquitlam, Port Coquitlam also has a plan of “gentle density” to add more housing units on detached lots. However, only 66 new homes have started in the entire Tri-Cities market so far this year. Port Coquitlam has seen housing sales double so far this year, to 69 in March and the benchmark home price is up 3.1% since January at $915,700, which is still down nearly 12% from a year ago. The sales-to-new-listing ratio in March was a balanced 54% as this seller’s market readies for the spring buying season with a total of 160 properties on the market.

Pitt Meadows: Total March sales were up 87% compared to both January and February, to 28 transactions, as the residential benchmark price edged up 2.5% from February to $846,500. This price remains 20% below March 2022. With a total of 69 active listings and a sales ratio of 65%, this is a seller’s market, but March saw a 59% increase in new listings from February, so buyer selection is improving. 

Maple Ridge: Maple Ridge benchmark prices also remain nearly 20% below a year ago, with detached houses selling for $1,179,500 in March, up a modest 1.1% from the first of this year. There was a total of 149 homes sold in March, 129% higher than in January and up 16% from February. With 495 active listings on the market and 54% of new listings selling in March, this is a steady seller’s market. Buyers may want to look at townhouses, now selling for $731,700, the lowest price in the Greater Vancouver mainland market, and down 19% from March 2022.

Ladner: Ladner continues to struggle for townhouse and condo listings, with townhouses only having 1 month supply and a 92% absorption rate and condos seeing the most sales since October 2021. In March, total sales of all property types were up 138% from January and the sales-to-listing ratio hit 55%. But this is not a balanced seller’s market, with townhouse prices up a market-leading 8.6% since the first of the year, to $998,500; and condo prices up 6.5% in the same period to $714,300. The supply of total residential listings is down to a 3-month inventory at the current sales pace.

Tsawwassen: Sunny Tsawwassen turned on the heat in March, with housing sales up 40% from a month earlier to 35 units. The strata market is sizzling, with townhouse benchmark prices rising 11.5% since January 1, to just over $1 million; and condo prices up 6.6% in the same period to $740,600 – a price slightly above March 2022 and 37% higher than even three years ago. This is pegged as a balanced market with a sales-to-listing ratio of 43%, but sellers are fully in control of the tight townhouse and condo sector. 

Surrey: The city posted an 84.8% increase in detached-house sales in March compared to a month earlier, with the composite benchmark price unchanged at $1,503,200, though still down 19.5% from March 2022. Townhouse sales were up 59% from February and condo sales rose 48%, month-over-month, to 217 transactions at an average price of $536,054. With active listings, sales and prices rising this year in every market from North Surrey to South Surrey-White Rock, B.C.'s second-biggest city is shaping up as a very active spring market, with buyers holding a slight edge.


Download March Sales and Listings Statistics Houses Townhouses Condos
Download March Sales and Listings Statistics All Regional
Download Stat Images

Kevin Skipworth, Partner/Broker and Chief Economist at Dexter Realty

Read

Sales and Listing Report for February 2023

Highlights of Dexter Realty’s February 2023 Report 

  • Prices increased month-over-month for the first time since May 2022

  • Housing sales are up 77% from January; new listings are up just 5%.

  • Multiple offers are being seen on Westside detached houses. 

  • Top townhouse market: New Westminster.

  • Undersupplied North Vancouver is now a seller’s market.

The last three years have been an anomaly for housing markets around the world and Greater Vancouver is no exception. That is why it is virtually useless to compare our current, back-to-reality environment with what was happening a year or two years ago during a once-in-a-century event.

In 2021, we were in the grip of a global pandemic and a home-buying frenzy with mortgage rates at record lows. In February 2022, housing sales and prices hit a white-hot peak just before the federal government hosed it down with the first of eight straight interest rate increases through the Bank of Canada.

Today, in February 2023, the panic buying is history, mortgage rates have stabilized, and buyers are back into the first normal housing market in four years. Driven by buyer demand and low supply, February marked the first month-to-month home price increase in nine months.

Greater Vancouver housing sales, at 1,824 transactions in February, were up 77% from January 2023 and 21% higher than in February 2019, before the whole pandemic-influenced housing boom-and-bust began. February sales were also higher than in November and December 2022, and, we believe, signal the start of a strong spring selling season.

Buyers are already competing with other buyers for far fewer listings. The number of new listings in February was the lowest for that month going back to pre-1991, much the same as it was in January. Compared to January 2023, listings were only up 5%. 

But, since sales have been slower over the past 10 months, a total of 8,283 homes were on the market at the of February, above the 7,862 active listings at the end of January and a few hundred more than in December 2022. 

With buyers flowing back into the market, immigration hitting record levels and interest rates settling down, this appears a prime time to encourage housing starts. However, governments at all levels appear to be doing their best to stunt new home construction.

  • The federal government has banned foreign buyers for two years, including those investing in residential land, if the developer has less than 97% Canadian ownership. For example, a 3,000-unit Burnaby residential development, now under construction, would not be allowed today because the developer is based out of London, England. The recent collapse of major condo developers in Metro Vancouver could be traced to the ban’s impact on companies with as little as a 3% foreign ownership. This has put thousands of new homes at risk.

  • The B.C. government is spending $500 million to stop or stall the private redevelopment of 50 and 60-year-old rental buildings into modern, higher-density housing projects.

  • Metro municipalities are jacking up development cost charges, even as housing starts fall. Among the examples is Richmond, where housing starts so far in 2023 total just 73 units, down 80% from the 381 starts at the same time a year ago. Richmond is raising DCC rates on single-family lots by $20,000 to $61,138, and raising the DCC rate for condo apartments and townhouses by 43% to more than $34 per square foot. This means that a modest new townhouse of 1,200 square feet will now cost about $41,000 just in city development fees. 

All governments preach about addressing the supply of ‘missing middle’ housing for families, which translates as townhouses. Yet only 3 townhouse units have started so far this year in the City of Vancouver, compared to just 21 units a year ago at this time – and a mere 90 townhouse units were started in all of 2022 across Metro Vancouver.

For residential investors, the consistent housing shortage is a blessing, which is why Metro Vancouver has become a “buy and hold” housing environment. Owners know that the law of supply and demand ensures that home prices will keep increasing. So they wait it out. In markets where sales levels are declining, an increase in new listings would add to the active listing count and provide downward pressure on prices. 

That’s not the Metro Vancouver market, where sales are turning back up.

Any increase in new listings will be absorbed by buyers. With the level of competition we are now seeing in the market, buyers are craving listings and competing for different product types in different areas. Active listing counts are up about 500 since the end of December. Absorption rates today are twice what they were in a similar market in 2019, and are only held in check by the lack of homes on the market.

The bottom line: Greater Vancouver listings are scarce at a time when they should be double what they are. 

Prior to 2015, having 15,000 to 20,000 active listings in Greater Vancouver was the norm. Since then, we’ve barely scratched above 15,000 and right now we are at half that level. Restrictive zoning and slow-moving development approvals continue to barricade supply. And without that supply, a seller’s markets will continue, at whatever level of demand we have in the market. 

A look at the Regional housing numbers: 

Greater Vancouver: Total housing sales were up 77% compared to January 2023, while new listings were up 5%. The result was the composite benchmark home price posted the first month-over-month increase since May of 2022, rising 1.1% to $1,123,400. Detached house prices rose 0.7%, to $1,813,000; condo apartment prices rose 1.6% to $732,200; and townhouse benchmark prices were up 1.8%, compared to a month earlier, to $1,038,500. Active Listings were at 8,283 at month-end compared to 7,062 at that time last year and 7,862 at the end of January. Greater Vancouver’s detached housing market is now seen as a balanced market, with both condo apartments and townhouses in a seller’s market. The total sales-to-new-listing ratio in February was 51%, compared to 30% in January 2023 and 62% in February 2022.

Fraser Valley: The Fraser Valley Real Estate Board processed 898 sales in February, an increase of 43.5% over January 2023, but still only half as many as were recorded a year ago. February new listings were up by 5.7% over January 2023 to 1,938 but 48.25% lower than in February 2023. Active listings were up 7% from a month earlier. The composite benchmark home price in February was $946,700 up 0.5%  from January 2023 and the first month-over-month increase since April 2022. Further, the benchmark price is 36% higher than in pre-pandemic February 2020. 

Vancouver Westside: February total sales, at 316, were up 63% from January 2023 and would have been even higher if more listings were available. One Westside house had 16 offers on it at the end of February, an indication of the demand. New listings were down 1% from January, but active listings as of month end were at 1,923, representing about a six-month supply. The sales-to-new-listing ratio is running at 44%, up from 27% a month earlier. There is a severe shortage of townhouses, with nearly half the 91 new listings selling in February at a median price of more than $1.48 million. No new townhouses have started construction this year on the Westside. The February benchmark price for a detached house on the Westside jumped 2.7% from a month earlier, to $3,103,100.

Vancouver East Side: Total housing sales in February, at 198, were up 68% from January 2023, but new listings were up by only 6%, while the sales-to-new-listing ratio reached a balanced 52%, up from 33% in January, and close to 55% ratio in the hot market a year ago. This is a market to watch. Benchmark prices were up in all sectors from a month earlier, led by a 2.9% surge in townhouse prices to $1,052,500. The supply of total residential listings is down to five months supply, with condos in seller’s market conditions. Benchmark condo prices were up 1% from January, to $683,600, based on 101 sales, double the number a month earlier.

North Vancouver: This perpetually under supplied market is a seller’s market with only a three-months supply of listings, even with growth in active listings of townhouses and condos. A total of 150 sales were seen in February, up 83% from a month earlier, but active listings were just 20 homes higher, at 436 units. With the sales-to-listing ratio at 59%, townhouse prices shot up 4.1% from January 2023, to $1,286200, and detached and condo benchmark prices were up nearly 2% from a month earlier.

West Vancouver: Sales increased 54%, month over month to 43 transactions, but because of a 21% spike in new listings, there is now a 10-month supply of homes, in this buyer’s market for detached houses. It remains a seller’s market for townhomes, because the supply is so low, perhaps one reason West Vancouver’s population is declining. West Van posted a modest decline in most prices compared to January, except for condo apartments, which were up 2.7% to a region-leading $1,228,900.

Richmond: Despite the angst in Richmond’s strata market – where an 800-unit development has gone into receivership and starts have plunged 80% from a year ago, total sales in February were up 89% from January. The benchmark composite home prices rose 2% from a month earlier with condos selling for $735,800; townhouses at $1,083,100; and detached houses at just over $2 million. With an overall sales-to-listing ratio of nearly 50%, the detached-house market is in balanced conditions, with a seller’s market building steam in the strata sector. 

Burnaby East: Total sales in February were 21, up 133% from a month earlier and the sales-to-listing ratio hit a stunning 105%, compared to a low of 20% in January 2023 and 52% in February of last year. This is a seller’s market on steroids with the composite benchmark price up 2.2% month-over-month to $1,102,900, the highest in Burnaby.

Burnaby North: With total sales up 113% from January 2023, to 134, and total active listings down 10%, this is also a seller’s market with a mere three-month supply of listings and a sales ratio of 66%. The saving grace is the high number of new condos coming to the market in the Brentwood-Gilmore area. The composite home price was up from January, led by a 2.4% surge in townhouse prices to $892,100.

Burnaby South: Many Burnaby buyers were southbound in February, driving total sales up 119% from a month earlier, to 118 transactions. Active listings were 377 at month end compared to 352 at the end of January, which translates to a three-month supply at the current sales pace. The composite benchmark price was up nearly 1% from January at $966,500. The sales-to-listing ratio is a healthy 57% with the strata sector in seller’s market conditions.

New Westminster: For buyers looking for scarce townhouses, the Royal City has a good selection. Only 3 townhouses sold in February and there is nine-month supply on the market. Benchmark townhouse prices, however, increased 4.4% from January 2023, to $932,200, the same price as in February 2023. Total housing sales in February were 65% higher than a month earlier, at 66, at new listings inched up by 1%. The overall sales-to-listing ratio is 62%, up from 38% in January 2023 with a buyer’s market for townhouse and condos and a balanced market for detached houses, where prices are up 2.4% or about $34,000 – from a month earlier at $1,418,100.

Coquitlam: It seems hard to understand with the amount of new multi-family construction over the past two years, but Coquitlam is seeing a shortage of strata homes. Coquitlam had one of the biggest turnarounds in February with sales up 116% compared to January. Townhouse sales went from 4 in January to 40 in February. With that, there is just a two-months of inventory for townhouses and condos. The composite benchmark price is up 0.7% from a month earlier, but townhouse prices rose 2.5% from January to $999,900. With an overall sales-to-listing ratio of 67%, this is a seller’s market for strata units and balanced in the detached sector.

Port Moody: Even with total listings of 200 at the end of February, and a significant increase in townhouse and condo listings, strata units are in a seller’s market, along with detached houses. There were more sales than new listings compared to January, with a 104% sales increase from the month previous, to 47 transactions while only 91 new listings in February compared to 103 in January. More than half (52%) of the new listings sold in February, while the composite benchmark price increased 1% to $1,093,100, the highest in the Tri-Cities. 

Port Coquitlam: There is only a one-month supply of townhouses with twice as many sales as new listings in February. Total housing sales reached 40, up a modest 18% from January 2023. The total supply of residential listings is down to four months, meaning a balanced market conditions for detached houses, with townhouses and condos in seller’s market conditions. The overall sales-to-listing ratio is a healthy 46% and the composite benchmark price has held steady (up 0.7%) for three months at $900,900.

Pitt Meadows: Sales didn’t budge month-over-month, with 15 transactions in February, while new listings fell 29% compared to January 2023. The total inventory remains at a four-month supply in this balanced market, with a sales-to-listing ratio of 55%. The composite benchmark home price fell 0.6% from January to $825,900.

Maple Ridge: Total housing sales in February were up 98% from January 2023 to 129 transactions, but new listings were down 4% from a month earlier. With a sales-to-listing ratio of 62%, the same as in February of last year and up from 30% in January 2023, this is a sellers’ market with just four months of inventory. Still, Maple Ridge plans to increase development cost charges this year to $41,000 for a new detached house, up from $22,465, and raise per-square-foot fees for new condo and townhouse units by 80%. The composite benchmark home price in February was up about 1% from January, at $918,300, but townhouse prices rose 3.5%, month over month, to $723,600.

Ladner: The townhouses market saw significant increases in sales and listings accounting for as many sales in February as detached and condos combined. Still, the total market was fairly brisk, with 27 transactions, up 69% from a month earlier and higher even than in February of last year. Townhouse prices spiked up 6.7% from January 2023 tied as the highest increase in Metro Vancouver – to $988,600. New listings were up 42% from a month earlier and there were 98 active listings as February ended. With a sales-to-listing ratio of 44%, this is a balanced market slanting towards a seller’s advantage for townhouses and condos.

Tsawwassen: Detached house listings were down 41% compared to January, while condos remain with a three-month supply. Detached houses and townhouses are in a balanced market. Total sales were rather tepid, at 25 transactions compared with 20 in January 2023 and 73 in February 2022. Perhaps buyers are tired of the back-and-forth Massey Tunnel replacement plan that doesn’t seem to ever get off (or under) the ground. This was noticeably absent from the recent provincial budget announcement and its three-year infrastructure plans. Despite a sales ratio of 47%, the composite benchmark price was down 3.7%, month-over-month, to $1,112,800, led by a sharp 7% drop in detached house prices.

Surrey: Benchmark home prices in Surrey were higher than in January, the first month-over-month increase since April of 2022. Detached house prices were up 0.7% to $1,503,200; townhouse prices rose 1% to $ $ 803,100 and condo apartment benchmark prices were up 1.4% to $522,700. The outlier is South Surrey-White Rock’s detached market, where prices slipped down 1.4% from January to $1,776,300, still the highest price in the Fraser Valley. With total Surrey sales up 61% from January 2023, at 132 transactions, and new listings up less than 15%, Surrey is considered a balanced market.

Download February Sales and Listings Statistics Houses Townhouses Condos

Download February Sales and Listings Statistics All Regional

Kevin Skipworth, Partner/Broker and Chief Economist at Dexter Realty

Read

Sales and Listing Report for Mid-February 2023

When the calendar turned to February, many would have liked to see the Groundhog determine the next 6 months of real estate instead of the next 6 weeks of weather here in Metro Vancouver. But we don’t need a groundhog to see the market is turning, but what it’s turning into isn’t exactly clear – other than more active and more competition among buyers.


Sales are picking up, showings and open houses are busier, but there is less exuberant activity when it comes to new listings. The tap to the spring market is on, but the question remains; how many listings will flow out of it?


At the mid-point of February, there have been 878 sales in Greater Vancouver, far higher than the 334 that had sold at the mid-point of January, and about 100 more sales than the mid-point of November and December last year. The numbers show a definite shift in activity, and more so the shift is felt in the chatter amongst REALTORS® who are commenting on the number of offers being received on new and existing listings. Showing activity is up considerably and buyers are out looking, even in the face of the latest increase by the Bank of Canada at the end of January. Of course, this is well below the 1,889 sales at the mid-point in February 2022, and 1,753 at the mid-point of February 2021. If we went back to mid-February 2019 though, it’s an increase on the 782 at that point – that being the most comparable market to what we are seeing in the last 8 months. 

At mid-month in Greater Vancouver there have been 1,846 new listings, which is above the 1,379 new listings at the mid-point of January but significantly below the 3,010 new listings at the midpoint of February 2022 and below the 2,240 new listings at the mid-point of February 2019. The slow climb of active listings continues with that number up to 8,072 after finishing 2022 with 7,791.


We would typically see a higher rate of increase moving through February, but many sellers are playing the wait and see game along with other sellers that don’t feel they have something to buy if they sell their current home. Our market continues to be one of a lack of homes and that’s not going to change any time soon.


A 24% sales-to-listings ratio in January has turned to 48% in February – meaning 1 out of every 2 homes listed is selling so far this month. This of course doesn’t consider those listings that expire or are taken off the market by sellers. With the absorption rate increasing, it’s putting more pressure on those listings coming to the market. And as a comparison to 2019, the absorption rate at the mid-month of February that year was 24% - a much slower pace of sales. This is reaffirming that in our current market, if there were more listings there would be a lot more sales.

What were some February notable markets? Burnaby North and South have seen more sales so far in February than all of January, along with Coquitlam while Ladner has already hit January’s peak. Burnaby East is suffering with a lack of listings with there only being 12 so far compared to 44 in all of January. Vancouver’s East Side condo market continues to be ultra competitive with as many sales so far as January while less than half the number of new listings – producing a 69% absorption rate. In Richmond, detached and townhomes have seen more sales so far compared to last month, while condos there are lagging. In most areas, detached homes are showing the strongest absorption rates – this after condos had been ruling the market. This isn’t the case in New Westminster where buyers are still showing a stronger propensity to buy in the condo market. And Coquitlam, while showing more strength in all segments of its market, still has buyers seeking condos. Perhaps a “if you build it, they will come” scenario there. And given recent reports stating that the actual demand for rental apartments is undercounted, it is literally a case of governments not building enough for the demand they don’t even realize exists. 

One of the more extreme areas is Port Coquitlam where the absorption rate for houses is 17% so far and townhouses 300% - only 3 new listings with 9 sales so far. And just through the tunnel, Ladner continues to have a limited supply of townhomes and condos with a 60 and 70% absorption rate. And in Tsawwassen, after seeing 41 new detached listings, there have only been 7 so far in February. And after there being no townhouse sales in January in Tsawwassen, there have been 3 so far with only 4 new listings.  


The market continues to scream for listings, and if you are considering selling, now is the time. The dull days of fall have turned into a faster pace as we move through winter and into spring. And while it’s not quite spring yet, there is certainly a spring in the real estate market in Metro Vancouver.


With the shorter month, total sales may not hit 2,000 for the first time since June 2022, but expect that to change in March as more listings come on and buyers competing look to find their home.


Here’s a summary of the numbers:

Greater Vancouver 

878 units sold so far in February 2023 compared to

334 units sold at mid-month in January 2023 
793 units sold at mid-month in December 2022 
795 units sold at mid-month in November 2022
1,889 units sold at mid-month in February 2022
1,753 units sold at mid-month in February 2021
1,039 units sold at mid-month in February 2020
782 units sold at mid-month in February 2019

1,846 new listings so far in February compared to

1,379 new listings at mid-month in January 2023
984 new listings at mid-month in December 2022 
3,010 new listings at mid-month in February 2022
1,639 new listings at mid-month in February 2021
1,935 new listings at mid-month in February 2020
2,240 new listings at mid-month in February 2019

Total active listings are at 8,072 compared to 6,477 at mid-month in February 2022, and 7,294 at mid-month in January 2023.

Sales to listings ratio is at 48% compared to 63% at mid-month in February 2022 and 24% at mid-month in January 2023.

Vancouver West 

143 units sold so far in February 2023 compared to

62 units sold at mid-month in January 2023 
157 units sold at mid-month in December 2022 
135 units sold at mid-month in November 2022
355 units sold at mid-month in February 2022
280 units sold at mid-month in February 2021
154 units sold at mid-month in February 2020
167 units sold at mid-month in February 2019

354 new listings so far in February compared to

303 new listings at mid-month in January 2023
194 new listings at mid-month in December 2022 
593 new listings at mid-month in February 2022
497 new listings at mid-month in February 2021
330 new listings at mid-month in February 2020
514 new listings at mid-month in February 2019

Total active listings are at 1,857 compared to 1,847 at mid-month in February 2022, and 1,723 at mid-month in January 2023.

Sales to listings ratio is at 40% compared to 60% at mid-month in February 2022 and 20% at mid-month in January 2023.

Vancouver East

95 units sold so far in February 2023 compared to

41 units sold at mid-month in January 2023 
75 units sold at mid-month in December 2022 
71 units sold at mid-month in November 2022
205 units sold at mid-month in February 2022
197 units sold at mid-month in February 2021
111 units sold at mid-month in February 2020
87 units sold at mid-month in February 2019

189 new listings so far in February compared to
144 new listings at mid-month in January 2023
109 new listings at mid-month in December 2022 
348 new listings at mid-month in February 2022
276 new listings at mid-month in February 2021
185 new listings at mid-month in February 2020
216 new listings at mid-month in February 2019

Total active listings are at 877 compared to 812 at mid-month in February 2022, and 793 at mid-month in January 2023.

Sales to listings ratio is at 50% compared to 59% at mid-month in February 2022 and 28% at mid-month in January 2023.

North Vancouver

68 units sold so far in February 2023 compared to

20 units sold at mid-month in January 2023 
69 units sold at mid-month in December 2022 
79 units sold at mid-month in November 2022
125 units sold at mid-month in February 2022
133 units sold at mid-month in February 2021
55 units sold at mid-month in February 2020
92 units sold at mid-month in February 2019

123 new listings so far in February compared to
93 new listings at mid-month in January 2023
62 new listings at mid-month in December 2022 
218 new listings at mid-month in February 2022
203 new listings at mid-month in February 2021
183 new listings at mid-month in February 2020
194 new listings at mid-month in February 2019

Total active listings are at 425 compared to 348 at mid-month in February 2022, and 377 at mid-month in January 2023.

Sales to listings ratio is at 55% compared to 57% at mid-month in February 2022 and 22% at mid-month in January 2023.

West Vancouver 

22 units sold so far in February 2023 compared to

8 units sold at mid-month in January 2023 
28 units sold at mid-month in December 2022 
14 units sold at mid-month in November 2022
44 units sold at mid-month in February 2022
47 units sold at mid-month in February 2021
20 units sold at mid-month in February 2020
25 units sold at mid-month in February 2019

84 new listings so far in February compared to

46 new listings at mid-month in January 2023
30 new listings at mid-month in December 2022 
137 new listings at mid-month in February 2022
83 new listings at mid-month in February 2021
77 new listings at mid-month in February 2020
107 new listings at mid-month in February 2019

Total active listings are at 424 compared to 348 at mid-month in February 2022, and 395 at mid-month in January 2023.

Sales to listings ratio is at 26% compared to 32% at mid-month in February 2022 and 17% at mid-month in January 2023.

Richmond

102 units sold so far in February 2023 compared to

47 units sold at mid-month in January 2023 
104 units sold at mid-month in December 2022 
128 units sold at mid-month in November 2022
218 units sold at mid-month in February 2022
200 units sold at mid-month in February 2021
127 units sold at mid-month in February 2020
116 units sold at mid-month in February 2019

255 new listings so far in February compared to

196 new listings at mid-month in January 2023
145 new listings at mid-month in December 2022 
400 new listings at mid-month in February 2022
292 new listings at mid-month in February 2021
236 new listings at mid-month in February 2020
273 new listings at mid-month in February 2019

Total active listings are at 1,011 compared to 851 at mid-month in February 2022, and 879 at mid-month in January 2023.

Sales to listings ratio is at 40% compared to 55% at mid-month in February 2022 and 24% at mid-month in January 2023.

Burnaby East 

7 units sold so far in February 2023 compared to

3 units sold at mid-month in January 2023 
7 units sold at mid-month in December 2022 
4 units sold at mid-month in November 2022
15 units sold at mid-month in February 2022
19 units sold at mid-month in February 2021
10 units sold at mid-month in February 2020
7 units sold at mid-month in February 2019

12 new listings so far in February compared to

11 new listings at mid-month in January 2023
13 new listings at mid-month in December 2022 
27 new listings at mid-month in February 2022
30 new listings at mid-month in February 2021
18 new listings at mid-month in February 2020
19 new listings at mid-month in February 2019

Total active listings are at 81 compared to 42 at mid-month in February 2022, and 69 at mid-month in January 2023.

Sales to listings ratio is at 58% compared to 56% at mid-month in February 2022 and 27% at mid-month in January 2023.

Burnaby North 

65 units sold so far in February 2023 compared to

21 units sold at mid-month in January 2023 
46 units sold at mid-month in December 2022 
51 units sold at mid-month in November 2022
128 units sold at mid-month in February 2022
93 units sold at mid-month in February 2021
58 units sold at mid-month in February 2020
46 units sold at mid-month in February 2019

112 new listings so far in February compared to

70 new listings at mid-month in January 2023
58 new listings at mid-month in December 2022 
170 new listings at mid-month in February 2022
132 new listings at mid-month in February 2021
90 new listings at mid-month in February 2020
78 new listings at mid-month in February 2019

Total active listings are at 395 compared to 253 at mid-month in February 2022, and 343 at mid-month in January 2023.

Sales to listings ratio is at 58% compared to 84% at mid-month in February 2022 and 30% at mid-month in January 2023.

Burnaby South 

58 units sold so far in February 2023 compared to

15 units sold at mid-month in January 2023 
57 units sold at mid-month in December 2022 
55 units sold at mid-month in November 2022
117 units sold at mid-month in February 2022
94 units sold at mid-month in February 2021
52 units sold at mid-month in February 2020
47 units sold at mid-month in February 2019

113 new listings so far in February compared to

66 new listings at mid-month in January 2023
45 new listings at mid-month in December 2022 
140 new listings at mid-month in February 2022
128 new listings at mid-month in February 2021
91 new listings at mid-month in February 2020
118 new listings at mid-month in February 2019

Total active listings are at 368 compared to 279 at mid-month in February 2022, and 324 at mid-month in January 2023.

Sales to listings ratio is at 51% compared to 84% at mid-month in February 2022 and 23% at mid-month in January 2023.

New Westminster 

30 units sold so far in February 2023 compared to

15 units sold at mid-month in January 2023 
31 units sold at mid-month in December 2022 
26 units sold at mid-month in November 2022
94 units sold at mid-month in February 2022
76 units sold at mid-month in February 2021
40 units sold at mid-month in February 2020
34 units sold at mid-month in February 2019

62 new listings so far in February compared to

37 new listings at mid-month in January 2023
22 new listings at mid-month in December 2022 
124 new listings at mid-month in February 2022
115 new listings at mid-month in February 2021
68 new listings at mid-month in February 2020
85 new listings at mid-month in February 2019

Total active listings are at 227 compared to 163 at mid-month in February 2022, and 203 at mid-month in January 2023.

Sales to listings ratio is at 48% compared to 76% at mid-month in February 2022 and 41% at mid-month in January 2023.

Coquitlam 

78 units sold so far in February 2023 compared to

22 units sold at mid-month in January 2023 
45 units sold at mid-month in December 2022 
68 units sold at mid-month in November 2022
138 units sold at mid-month in February 2022
145 units sold at mid-month in February 2021
92 units sold at mid-month in February 2020
75 units sold at mid-month in February 2019

129 new listings so far in February compared to

107 new listings at mid-month in January 2023
64 new listings at mid-month in December 2022 
230 new listings at mid-month in February 2022
204 new listings at mid-month in February 2021
165 new listings at mid-month in February 2020
154 new listings at mid-month in February 2019

Total active listings are at 485 compared to 359 at mid-month in February 2022, and 203 at mid-month in January 2023.

Sales to listings ratio is at 60% compared to 60% at mid-month in February 2022 and 21% at mid-month in January 2023.

Port Moody

19 units sold so far in February 2023 compared to

2 units sold at mid-month in January 2023 
28 units sold at mid-month in December 2022 
16 units sold at mid-month in November 2022
41 units sold at mid-month in February 2022
36 units sold at mid-month in February 2021
18 units sold at mid-month in February 2020
17 units sold at mid-month in February 2019

49 new listings so far in February compared to

43 new listings at mid-month in January 2023
32 new listings at mid-month in December 2022 
77 new listings at mid-month in February 2022
54 new listings at mid-month in February 2021
50 new listings at mid-month in February 2020
43 new listings at mid-month in February 2019

Total active listings are at 203 compared to 107 at mid-month in February 2022, and 165 at mid-month in January 2023.

Sales to listings ratio is at 39% compared to 53% at mid-month in February 2022 and 5% at mid-month in January 2023.

Port Coquitlam 

20 units sold so far in February 2023 compared to

16 units sold at mid-month in January 2023 
17 units sold at mid-month in December 2022 
24 units sold at mid-month in November 2022
55 units sold at mid-month in February 2022
60 units sold at mid-month in February 2021
46 units sold at mid-month in February 2020
25 units sold at mid-month in February 2019

45 new listings so far in February compared to

29 new listings at mid-month in January 2023
34 new listings at mid-month in December 2022 
79 new listings at mid-month in February 2022
86 new listings at mid-month in February 2021
55 new listings at mid-month in February 2020
73 new listings at mid-month in February 2019

Total active listings are at 132 compared to 88 at mid-month in February 2022, and 123 at mid-month in January 2023.

Sales to listings ratio is at 44% compared to 70% at mid-month in February 2022 and 55% at mid-month in January 2023.

Ladner 

16 units sold so far in February 2023 compared to

5 units sold at mid-month in January 2023 
5 units sold at mid-month in December 2022 
7 units sold at mid-month in November 2022
13 units sold at mid-month in February 2022
27 units sold at mid-month in February 2021
20 units sold at mid-month in February 2020
13 units sold at mid-month in February 2019

35 new listings so far in February compared to

18 new listings at mid-month in January 2023
14 new listings at mid-month in December 2022 
30 new listings at mid-month in February 2022
42 new listings at mid-month in February 2021
33 new listings at mid-month in February 2020
29 new listings at mid-month in February 2019

Total active listings are at 91 compared to 49 at mid-month in February 2022, and 72 at mid-month in January 2023.

Sales to listings ratio is at 46% compared to 43% at mid-month in February 2022 and 28% at mid-month in January 2023.

Tsawwassen

15 units sold so far in February 2023 compared to

7 units sold at mid-month in January 2023 
19 units sold at mid-month in December 2022 
14 units sold at mid-month in November 2022
50 units sold at mid-month in February 2022
30 units sold at mid-month in February 2021
18 units sold at mid-month in February 2020
11 units sold at mid-month in February 2019

23 new listings so far in February compared to

21 new listings at mid-month in January 2023
16 new listings at mid-month in December 2022 
56 new listings at mid-month in February 2022
33 new listings at mid-month in February 2021
52 new listings at mid-month in February 2020
26 new listings at mid-month in February 2019

Total active listings are at 135 compared to 87 at mid-month in February 2022, and 120 at mid-month in January 2023.

Sales to listings ratio is at 65% compared to 89% at mid-month in February 2022 and 33% at mid-month in January 2023.

Download February Sales and Listings Statistics Houses Townhouses Condos

Download February Sales and Listings Statistics All Regional

Read

Sales and Listing Report for January 2023

 “The greatest danger for most of us is not that our aim is too high and we miss it, but that it is too low and we reach it.” Michelangelo


2023: the year to get in position for the recovery


January 2023 signalled early that it would end with what the Real Estate Board of Greater Vancouver says is “among the lowest sales month in recent history.”

As of mid-month, total transactions had reached just 334 properties, well below the 795 in mid-December 2022 or the 778 in mid-January 2022. The slow sales reflected not only higher mortgage rates but a barrage of anti-demand government policies that started the New Year.

Having dealt with a City of Vancouver Empty Homes Tax, the provincial Speculation and Vacancy Tax and a provincial foreign buyer’s tax, effective January 1, we now have a provincial three-day Home Buyer Rescission Period (or ‘cooling-off’ period), a two-year ban on foreign buyers across Canada, a national Underused Homes Tax – essentially a Canada wide empty-homes tax for foreign-owned properties – and a national anti-flipping tax which would see any profits for sales within a year of purchase taxed as business income. And of course, Canada’s prime lending rate has doubled from a year earlier, due to eight straight Bank of Canada increases.

It is a wonder all this didn’t kill home buying all together.
Yet a close look at Metro Vancouver shows flashes of high-performing regional markets in January and evidence that, despite misplaced and heavy-handed government policies, many people remain eager to purchase.

January ended with 1,030 properties sold of all types across Greater Vancouver, meaning sales more than doubled in the past two weeks of the month compared to the first half. As well, new listings increased from 1,379 in the first two weeks of January to end with 3,384, but this was still the lowest number of new listings for January going back to before 1991 – more than thirty years ago.
This speaks to the one thing keeping prices from declining more than they have. Sellers are not desperate. There is a lot of equity in owning a home and that keeps buyers from going into the market and from sellers rushing to get out. Since the start of the pandemic three years ago, the composite home price in Greater Vancouver has increased by 26%, or about $286,000. The typical detached house is now worth $411,000 more than in January 2020, at a January 2023 benchmark of $1,801,300.
If there is one prediction that could be made about this market, it’s that listings will not be coming in abundance.

Despite all the government rhetoric about creating more housing, policies are failing to address the underlying lack of supply. In 2022, for instance, total non-rental housing starts in Metro Vancouver fell 18% from a year earlier to just 16,116 units. And, despite a year-over-year increase in rental construction, Metro Vancouver rents are now the highest in history and the most expensive in Canada.

In some markets, the low inventory sparked bidding wars in January and turned key suburban municipalities into seller’s markets as tenants aimed to move into ownership and owners tried to improve their housing.

Here are some markets bucking the downward sales trend:

  • A Richmond condo listing attracted 11 offers in January as the local condo market moved from a balanced to a seller’s advantage.

  • In North Vancouver, townhomes and condos are in a seller’s market with January townhouse sales at similar levels to January 2022.

  • The strata sector was in seller’s market conditions in North Burnaby, New Westminster and even Coquitlam, despite a multi-family building boom in all three cities.

  • In 12 of the 22 Greater Vancouver markets, townhouse prices increased from December 2022 to January 2023 and were up an average of 0.8% across the entire region to $1,020,400, while benchmark condo apartment prices rose 1% month-over-month to $720,700.

These are not the signs of a distressed housing market – there are instead signals that buyers, confident that interest rate hikes have ended for now, are willing to come back into the market. If there were more listings, there would be more sales. It is as simple as that.

And listings of resale housing are starting to increase. The total number of homes currently listed for sale in Greater Vancouver is 7,478, a 32.1% increase compared to January 2022 and 1.3% higher compared to December 2022.

All predictions are that 2024 will see improved housing sales and ascending prices. This is the year for buyers to position themselves for that recovery in a still vibrant housing environment with upside potential. In fact, we believe 2023 will be a much stronger market than most pundits are predicting.

Despite headwinds through 2023, there is far too much demand to keep this real estate market from doing anything but grow.

Summary of Greater Vancouver markets in January 2023

Greater Vancouver: With total housing sales down 56% this January compared to January 2022, the January 2023 composite home price was 6.6% lower year-over-year and a mere 0.3% lower than in December 2022, to $1,111,400. Total active Listings were 7,862 at month-end compared to 5,987 at that time last year and 7,791 at the end of December, while new listings in January 2023 were up an expected 173% compared to December 2022. For all property types, the sales-to-listings ratio for January 2023 was 30%. By property type, the ratio is 28% for detached homes, 28% for townhomes, and 33% for apartments. With 571 transactions in the month, condos accounted for more than half of all sales in January, with townhouse sales at 156 and detached house transactions at 295. With an 8-month supply of inventory, this is overall a buyer’s market that is gaining strength.

Fraser Valley: With 626 transactions in January 2023, housing sales were off 12.6% compared to December 2022 and down by 52.2% compared to January 2022 to the lowest level in 10 years. The Fraser Valley Real Estate Board reports that “pent-up demand that has been building since the last quarter of 2022 will likely give rise to a sales uptick, especially if rate hikes subside, which we expect will be the case.” New listings saw an increase of 128.3% over December 2022 to 1,833 but remain at the lowest level for January since 1984. Active listings rose 5% to 4,118 compared to December 2022 and were up 76.6% compared to January 2022. At $942,200, the composite benchmark home price edged down 1.4% from December and was off 15% compared to January 2022.

Vancouver Westside: Total sales in January were 194, down 56% from the same month a year earlier and 20% below December 2022. New listings were up 196% compared to December but 29% lower than a year ago. There are less detached homes for sale than at this time last year, but this may change. In January, the City of Vancouver introduced Adding Missing Middle Housing and Simplifying Regulations in Low-Density Neighbourhoods, which would see the opportunity to develop multi-unit housing in single-detached RS zones throughout the city. The proposed changes allow up to four units on a typical 33-foot city lot, and 6 units on a 55-foot lot, subject to two rounds of public engagement. A final report and public hearing to be brought before Council in the fall of 2023. Meanwhile, investors and developers will be angling to purchase detached houses to take advantage of the upzoning. The benchmark price of the 25 detached houses sold in January on the Westside was $3,020,600, down 11.6% from a year earlier. The supply of total residential listings is up to 9 month’s supply (buyer’s market conditions) and sales-to-listings ratio is 27% compared to 100% in December 2022 and 44% in January 2022.

Vancouver East Side: Upzoning of detached house lots may eventually have an even greater impact on the East Side, due to the addition of two SkyTrain extensions and lower prices. The typical detached house sold in January for $1,664,900, or about half that of the Westside, and down 9.3% from a year earlier. Total sales of all properties were 118 in January, down 54% from a year ago. Condos sales, with 56, led local transactions and the benchmark condo price held steady from December 2022, at $676,800. Total active listings were 867 at month-end compared to 739 at that time last year and 880 at the end of December 2022. The supply of total residential listings is steady at a 7-month’s supply (balanced to buyer’s market conditions) and the sales-to-listings ratio of 33% compared with 85% in December 2022 and 54% in January 2022.

North Vancouver: A deep sleep in sales was seen in January with only 82 transactions, down 45% from a year earlier. Only 18 detached sales were seen, with the benchmark price of $2,033,000 down just 2.3% from a month earlier and 9.5% below January 2022. Meanwhile, 48 condos sold at a benchmark of $749,000, down less than 1% from December 2022. Both townhomes and condos are in seller’s market conditions with townhouse sales at similar levels to January 2022. Total active listings were at 416 at month-end compared to 291 at that time last year and 385 at the end of December 2022. Total residential listings are up to 5 month’s supply (balanced market conditions) and the sales-to-listings ratio of 35% compared to 132% in December 2022 and 55% in January 2022.

West Vancouver: Benchmarked at $3,074,400 in January, West Vancouver detached house prices are holding remarkably steady, down just 0.6% from a month earlier and less than 6% below January 2022, based on 16 sales. Total properties sold in January were 28, down 30% from December 2022 and down 38% from January 2022. The total residential listings are up to 15-month supply and the sales-to-listings ratio of 22% compared to 85% in December 2022 and 32% in January 2022. This is a full-on buyer’s market for those who can afford it.

Richmond: For the first time in two years, the average (not benchmark) home price in Richmond dipped below the $1 million mark in January, falling to $977,143, which was down from more than $1.2 million a year earlier. While total sales in January, at 120, were off 65% from a year earlier, there was action in the strata market. In one case a condo apartment attracted nearly a dozen offers. There were 81 condo sales in the month at a benchmark price of $720,700, a price up 4.6% from a month earlier and 3% higher than in January 2022. Richmond benchmark townhouse prices, at $1,065,600, are 2% higher than a year ago and edged up 1.5% from December 2022. Total active listings were 942 at month-end compared to 752 at that time last year and 919 at the end of December. Richmond is a buyer’s market with an 8-month supply and a sales-to-listing ratio at a weak 29%.

Burnaby East: Only 9 homes sold in January, perhaps the lowest ever recorded and below even the sluggish January 2019 which posted 11 transactions. Listings are increasing, posting a 214% spike up from December, which may keep prices in check. In January, the composite home price was $1,079,300, down 5.3% from a year earlier. There are 10 months of housing inventory in this buyer’s market, where the sales success ratio is a low 20%.

Burnaby North: Total sales were down 56% from a year earlier with 63 transactions in January at a composite benchmark of $954,200, a price down 4.7% year-over-year and off 1.1% from December 2022. (Benchmark prices slipped below $1 million last August and have been slowly descending since). Despite a lot of new condos being built over the past three years, condo prices are holding firm, benchmarked at $696,600 in January, a price 0.2% higher than in January 2022. This is considered an overall balanced market, with about a six-month supply of total listings and a sales-to-listings ratio of 31%

Burnaby South: Just 54 sales were seen in January, down from 94 a month earlier and 64% below the pace in January 2022. The composite benchmark price of $1,052,800, however, was up marginally from December 2022 and down less than 1% from a year ago. Active listings were at 352 at month-end compared to 283 at that time last year and 344 at the end of December. This is a buyer’s market, despite the sticky prices, with an inventory of a 7-months’ supply and a sales-to-listing ratio of 33%, far below the 152% seen in December 2022.

New Westminster: New West flirted with a seller’s market in December 2022 but was more balanced in January as sales dipped to 40 transactions, down 25% from a month earlier and 61% below January 2022. There has been increased action in the detached housing market, particularly in the Sapperton and the Massey-Victoria Heights areas, where quick sales were seen, some above asking, at the end of January. While the benchmark detached house price is $1,384,000, New Westminster has one of the lowest composite home prices in a SkyTrain-served community, at $782,300. Both benchmark townhouse prices ($892,300 ) and condo apartments ($622,500) are higher now than a month and a year ago, which is rare in Metro Vancouver. This is considered a balanced market, with a 6-month supply of listings and a sales-to-listings ratio of 38%.

Coquitlam: Coquitlam posted 73 residential property sales in January, down 10% from December 2022 and 58% less than in January 2022, and this is considered a buyer’s market with 484 active listings – about a 7-month supply – and sales-to-listing ratio of a low 28%, compared to 107% in December 2022. Condo demand and prices are firm: 48 apartments sold in January at a benchmark price of $656,300, a price nearly unchanged (down 0.9%) from a year earlier. Just 4 townhouses sold in January, but the benchmark price of $975,000 was down just 0.3% from December 2022.

Port Moody: Total sales in January were 23 – down from 41 (44%) in December 2022 and down from 57 (60%) in January 2022. Active listings were 188 at month end, compared to 93 at that time last year and 155 at the end of December 2022. New listings in January were up 145% compared to December 2022 and up 29% compared to January 2022. This is a buyer’s market, with the composite home price virtually unchanged from a year ago, at $1,083,700.

Port Coquitlam: Buyers withdrew from Port Coquitlam in January, and we suspect relatively high prices may be to blame in the only Tricities market with no SkyTrain. The benchmark detached house has shot up 38% since January 2020 and, even with an 11% decline in the last year, is still at $1,279,200. Just 13 detached houses sold in January, down from 29 in the same month last year. However, this is technically a seller’s market because there is only a 4-month supply of listings and the overall sales-to-listing ratio is running at 44%, with detached houses at 66%.

Pitt Meadows: Total sales in January slumped 50% from a year earlier to just 15 transactions as the composite home price in the small community fell 15% in the same period to $830,600.
Still, this is also seen as seller’s market because a lack of listings translates to just a 4-month supply. The current sales-to-listings ratio of 39% compares to 191% in December 2022 and 73% in January 2022, so sellers have a fragile advantage at best.

Maple Ridge: Maple Ridge, where the composite home price of $910,000 is still 38% higher than in pre-pandemic January 2020, also saw total sales slide in January, dropped 47% from a year earlier and 17% from a month ago, to 65 transactions. The benchmark price of a detached house, the dominant sales sector, is $1,166,000, down 16.2% from a year ago and declining by an average of about 1.5% per month since last fall. New Listings in January were up 232% compared to December 2022 and the total inventory of listings is up to 7 month’s supply (balanced to buyer’s market conditions), with a sales-to-listings ratio of 30% compared to 120% in December 2022 and 51% in January 2022.

Ladner: With 16 sales in January, up from 9 in December, Ladner saw its total supply of homes for sale drop from an 8 to a 5-month inventory in January, despite new listings jumping 209% month-over-month. Detached house prices are down 16% from January 2022, to $1,267,700, but are declining 2.5% per month. This is a balanced market tilting towards a buyer’s advantage with lower prices and a rather tepid sales-to-listing ratio of 37%, about half that of December 2022.

Tsawwassen: Tsawwassen posted zero townhouse sales in January, but only having 3 new listings will lead to that. Based on December sales, therefore, the benchmark townhouse price remains 4.4% lower from a year ago, at $937,100. Detached house prices are down 11% year-over-year to $1,434,600 but remain 30% higher than in pre-pandemic January 2020.
Total housing sales were 20 in January, down 52% from a year earlier, but new listings were up 185% from December 2022. This is a balanced market with a healthy supply of listings and a sales ratio of 35%, down sharply from 115% a month earlier.

Surrey:Surrey housing sales slumped across the board in January, with detached house transactions down 67.8% year-over-year, townhouse sales down nearly 50% and condo apartment sales falling 60% compared to January 2022. Benchmark prices followed suit, with detached house prices dropping 22% to $1,552,110; townhouse prices down 16% from a year ago to $807,200 and condo prices dipping 7.5% year-over-year to $526,938. With active listings rising and sales and prices falling, Surrey is a serious buyer’s market right now. Opportunity exists in that market.

Download December Sales and Listings Statistics Houses Townhouses Condos
Download December Sales and Listings Statistics All Regional
Download Stat Images

Kevin Skipworth
Partner/Broker and Chief Economist at Dexter Realty

Read

Sales and Listing Report for Mid-January 2023

It’s not how it looks.

As the calendar turned to 2023, real estate in British Columbia became a lot more complicated. Having dealt with a City of Vancouver Empty Homes Tax, the provincial Speculation and Vacancy Tax and a provincial foreign buyer’s tax, we were given the gift of a provincial 3 Day Home Buyer Rescission Period, a two-year ban on foreign buyers across Canada and a national Underused Homes Tax – essentially a Canada wide empty homes tax for foreign owned properties. If your new years resolution was more government regulation, you got it! While all these policies really just attack the demand side of the home buying equation, we started the year yet again with an extremely low level of active listings, and so far that’s not changing. While sales are slow to start the year, we are only two weeks in and rescission or not, buyers are out shopping. Will they find more homes stocked on the shelves as we move through the first part of 2023, that remains an important question.

At the mid-point of January, there have been 334 sales in Greater Vancouver. This is well below the 795 at the mid-point in December and of course below the 788 at the mid-point of January last year, which was a completely different market. If we compare to January 2019, which was coming out of one of the slowest years on record, it was more closely matched with there being 396 sales in January 2019. It’s still early, and the number of sales in January in the second half tend to be more than 3 times what they are in the first two weeks. And if there is a more significant increase in the number of new listings, the number of sales will be that much higher. January 2019 finished with 1,120 sales after a similar start to this month, so it is quite likely we’ll see similar numbers if not more depending on whether sellers come to the market this month. And judging by the comments of REALTORS® over the last week, open houses have been much busier than the fall and there have been multiple offers occurring on what limited number of homes there are on the market. After sitting through the last few months of the year, some listings are seeing offers come in. Perhaps a sign that buyers are adjusting to the new levels of interest rates and that the pent-up demand is starting to get more active. And most certainly a sign that sellers may want to jump on an early spring market.

At mid-month in Greater Vancouver there have been only 1,379 new listings, which is above the 984 new listings at the mid-point of December but significantly below the 1,639 new listings at the midpoint of January 2022 and much more below the number of new listings of 1,940 at the mid-point of January 2019 – you know, that other slow market period. After seeing active listings drop below 7,000 in Greater Vancouver, there are now 7,294 listings, up, but ever so slightly. A 24% sales-to-listings ratio has helped, but with the few numbers of new listings, it’s not adding much to the well of active listings so far.

While it is too early to recognize trends in any market, North Vancouver, West Vancouver, and Port Moody appear to be the slowest out of the gate for sales. As of the middle of the month, Port Moody only had two sales – and they were condos and North Vancouver had only seen one townhouse sale. Certainly, in the case of Port Moody, the available number of new listings is a contributing factor in the low number of sales. New Westminster is following along the same path for new listings as December, very few and as a result that’s hold back sales. Coquitlam is bucking the trend with a higher pace of new listings so far in January, with the condo segment being the larger extend of new listings. And with, Coquitlam City Council starting its first meeting of 2023 by sending the Polygon proposal for a massive development out for comment that would see 2,835 units built at the Port Moody border, just north of Lougheed Highway. This would be similar to what Marcon Quadreal is planning to build at the corner of Lougheed and Barnet Highway. All while Port Moody seeing a bid from Wesgroup come in to assemble 59 single-family homes for a high-density development. These two cities are focussing on development – perhaps something others should take note of. And given the lack of listings buyers have to shop from, they can’t come soon enough.

Here’s a summary of the numbers:

Greater Vancouver

334 units sold so far in January 2023 compared to
793 units sold at mid-month in December 2022
788 units sold at mid-month in January 2022
977 units sold at mid-month in January 2021
538 units sold at mid-month in January 2020
396 units sold at mid-month in January 2019

1,379 new listings so far in January compared to
984 new listings at mid-month in December 2022
1,639 new listings at mid-month in January 2022
2,185 new listings at mid-month in January 2021
1,924 new listings at mid-month in January 2020
1,940 new listings at mid-month in January 2019

Total active listings are at 7,294 compared to 5,427 at mid-month in January 2022, and 8,787 at mid-month in December 2022.

Sales to listings ratio is at 24% compared to 48% at mid-month in January 2022 and 81% at mid-month in December 2022.

Vancouver West

62 units sold so far in January 2023 compared to
157 units sold at mid-month in December 2022
152 units sold at mid-month in January 2022
154 units sold at mid-month in January 2021
89 units sold at mid-month in January 2020
57 units sold at mid-month in January 2019

303 new listings so far in January compared to
194 new listings at mid-month in December 2022
395 new listings at mid-month in January 2022
426 new listings at mid-month in January 2021
178 new listings at mid-month in January 2020
193 new listings at mid-month in January 2019

Total active listings are at 1,723 compared to 1,637 at mid-month in January 2022, and 2,085 at mid-month in December 2022.

Sales to listings ratio is at 20% compared to 48% at mid-month in January 2022 and 81% at mid-month in December 2022.

Vancouver East

41 units sold so far in January 2023 compared to
75 units sold at mid-month in December 2022
88 units sold at mid-month in January 2022
97 units sold at mid-month in January 2021
48 units sold at mid-month in January 2020
41 units sold at mid-month in January 2019

144 new listings so far in January compared to
109 new listings at mid-month in December 2022
153 new listings at mid-month in January 2022
236 new listings at mid-month in January 2021
178 new listings at mid-month in January 2020
193 new listings at mid-month in January 2019

Total active listings are at 793 compared to 652 at mid-month in January 2022, and 979 at mid-month in December 2022.

Sales to listings ratio is at 28% compared to 58% at mid-month in January 2022 and 69% at mid-month in December 2022.

North Vancouver

20 units sold so far in January 2023 compared to
69 units sold at mid-month in December 2022
49 units sold at mid-month in January 2022
55 units sold at mid-month in January 2021
30 units sold at mid-month in January 2020
31 units sold at mid-month in January 2019

93 new listings so far in January compared to
62 new listings at mid-month in December 2022
82 new listings at mid-month in January 2022
155 new listings at mid-month in January 2021
163 new listings at mid-month in January 2020
151 new listings at mid-month in January 2019

Total active listings are at 377 compared to 233 at mid-month in January 2022, and 442 at mid-month in December 2022.

Sales to listings ratio is at 22% compared to 60% at mid-month in January 2022 and 111% at mid-month in December 2022.

West Vancouver

8 units sold so far in January 2023 compared to
28 units sold at mid-month in December 2022
11 units sold at mid-month in January 2022
20 units sold at mid-month in January 2021
10 units sold at mid-month in January 2020
7 units sold at mid-month in January 2019

46 new listings so far in January compared to
145 new listings at mid-month in December 2022
52 new listings at mid-month in January 2022
96 new listings at mid-month in January 2021
91 new listings at mid-month in January 2020
59 new listings at mid-month in January 2019

Total active listings are at 395 compared to 337 at mid-month in January 2022, and 496 at mid-month in December 2022.

Sales to listings ratio is at 17% compared to 21% at mid-month in January 2022 and 76% at mid-month in December 2022.

Richmond

47 units sold so far in January 2023 compared to
104 units sold at mid-month in December 2022
130 units sold at mid-month in January 2022
127 units sold at mid-month in January 2021
92 units sold at mid-month in January 2020
49 units sold at mid-month in January 2019

196 new listings so far in January compared to
145 new listings at mid-month in December 2022
266 new listings at mid-month in January 2022
277 new listings at mid-month in January 2021
264 new listings at mid-month in January 2020
293 new listings at mid-month in January 2019

Total active listings are at 879 compared to 722 at mid-month in January 2022, and 1,048 at mid-month in December 2022.

Sales to listings ratio is at 24% compared to 49% at mid-month in January 2022 and 72% at mid-month in December 2022.

Burnaby East

3 units sold so far in January 2023 compared to
7 units sold at mid-month in December 2022
6 units sold at mid-month in January 2022
5 units sold at mid-month in January 2021
8 units sold at mid-month in January 2020
3 units sold at mid-month in January 2019

11 new listings so far in January compared to
13 new listings at mid-month in December 2022
11 new listings at mid-month in January 2022
19 new listings at mid-month in January 2021
21 new listings at mid-month in January 2020
22 new listings at mid-month in January 2019

Total active listings are at 69 compared to 29 at mid-month in January 2022, and 91 at mid-month in December 2022.

Sales to listings ratio is at 27% compared to 55% at mid-month in January 2022 and 54% at mid-month in December 2022.

Burnaby North

21 units sold so far in January 2023 compared to
46 units sold at mid-month in December 2022
36 units sold at mid-month in January 2022
61 units sold at mid-month in January 2021
38 units sold at mid-month in January 2020
22 units sold at mid-month in January 2019

70 new listings so far in January compared to
58 new listings at mid-month in December 2022
83 new listings at mid-month in January 2022
130 new listings at mid-month in January 2021
99 new listings at mid-month in January 2020
91 new listings at mid-month in January 2019

Total active listings are at 343 compared to 236 at mid-month in January 2022, and 391 at mid-month in December 2022.

Sales to listings ratio is at 30% compared to 43% at mid-month in January 2022 and 79% at mid-month in December 2022.

Burnaby South

15 units sold so far in January 2023 compared to
57 units sold at mid-month in December 2022
54 units sold at mid-month in January 2022
72 units sold at mid-month in January 2021
41 units sold at mid-month in January 2020
23 units sold at mid-month in January 2019

66 new listings so far in January compared to
45 new listings at mid-month in December 2022
116 new listings at mid-month in January 2022
136 new listings at mid-month in January 2021
106 new listings at mid-month in January 2020
105 new listings at mid-month in January 2019

Total active listings are at 324 compared to 264 at mid-month in January 2022, and 835 at mid-month in December 2022.

Sales to listings ratio is at 23% compared to 47% at mid-month in January 2022 and 127% at mid-month in December 2022.

New Westminster

15 units sold so far in January 2023 compared to
31 units sold at mid-month in December 2022
38 units sold at mid-month in January 2022
36 units sold at mid-month in January 2021
18 units sold at mid-month in January 2020
27 units sold at mid-month in January 2019

37 new listings so far in January compared to
22 new listings at mid-month in December 2022
62 new listings at mid-month in January 2022
100 new listings at mid-month in January 2021
18 new listings at mid-month in January 2020
27 new listings at mid-month in January 2019

Total active listings are at 203 compared to 145 at mid-month in January 2022, and 264 at mid-month in December 2022.

Sales to listings ratio is at 41% compared to 61% at mid-month in January 2022 and 141% at mid-month in December 2022.

Coquitlam

22 units sold so far in January 2023 compared to
45 units sold at mid-month in December 2022
64 units sold at mid-month in January 2022
104 units sold at mid-month in January 2021
57 units sold at mid-month in January 2020
27 units sold at mid-month in January 2019

107 new listings so far in January compared to
64 new listings at mid-month in December 2022
91 new listings at mid-month in January 2022
161 new listings at mid-month in January 2021
140 new listings at mid-month in January 2020
144 new listings at mid-month in January 2019

Total active listings are at 434 compared to 255 at mid-month in January 2022, and 536 at mid-month in December 2022.

Sales to listings ratio is at 21% compared to 70% at mid-month in January 2022 and 70% at mid-month in December 2022.

Port Moody

2 units sold so far in January 2023 compared to
28 units sold at mid-month in December 2022
19 units sold at mid-month in January 2022
17 units sold at mid-month in January 2021
16 units sold at mid-month in January 2020
10 units sold at mid-month in January 2019

43 new listings so far in January compared to
32 new listings at mid-month in December 2022
25 new listings at mid-month in January 2022
34 new listings at mid-month in January 2021
31 new listings at mid-month in January 2020
25 new listings at mid-month in January 2019

Total active listings are at 165 compared to 81 at mid-month in January 2022, and 167 at mid-month in December 2022.

Sales to listings ratio is at 5% compared to 76% at mid-month in January 2022 and 88% at mid-month in December 2022.

Port Coquitlam

16 units sold so far in January 2023 compared to
17 units sold at mid-month in December 2022
19 units sold at mid-month in January 2022
25 units sold at mid-month in January 2021
21 units sold at mid-month in January 2020
16 units sold at mid-month in January 2019

29 new listings so far in January compared to
34 new listings at mid-month in December 2022
44 new listings at mid-month in January 2022
80 new listings at mid-month in January 2021
65 new listings at mid-month in January 2020
67 new listings at mid-month in January 2019

Total active listings are at 123 compared to 66 at mid-month in January 2022, and 166 at mid-month in December 2022.

Sales to listings ratio is at 55% compared to 43% at mid-month in January 2022 and 50% at mid-month in December 2022.

Ladner

5 units sold so far in January 2023 compared to
5 units sold at mid-month in December 2022
9 units sold at mid-month in January 2022
7 units sold at mid-month in January 2021
12 units sold at mid-month in January 2020
1 units sold at mid-month in January 2019

18 new listings so far in January compared to
14 new listings at mid-month in December 2022
16 new listings at mid-month in January 2022
15 new listings at mid-month in January 2021
37 new listings at mid-month in January 2020
24 new listings at mid-month in January 2019

Total active listings are at 72 compared to 34 at mid-month in January 2022, and 86 at mid-month in December 2022.

Sales to listings ratio is at 28% compared to 56% at mid-month in January 2022 and 36% at mid-month in December 2022.

Tsawwassen

7 units sold so far in January 2023 compared to
19 units sold at mid-month in December 2022
13 units sold at mid-month in January 2022
16 units sold at mid-month in January 2021
7 units sold at mid-month in January 2020
2 units sold at mid-month in January 2019

21 new listings so far in January compared to
16 new listings at mid-month in December 2022
33 new listings at mid-month in January 2022
43 new listings at mid-month in January 2021
37 new listings at mid-month in January 2020
37 new listings at mid-month in January 2019

Total active listings are at 120 compared to 74 at mid-month in January 2022, and 135 at mid-month in December 2022.

Sales to listings ratio is at 33% compared to 39% at mid-month in January 2022 and 119% at mid-month in December 2022.

Download Sales and Listings Statistics Houses Townhouses Condos
Download Sales and Listings Statistics All Regional

Kevin Skipworth
Partner/Broker and Chief Economist at Dexter Realty

Read

Sales and Listing Report December 2022: A year ends with a flourish and a new year begins with confidence.

We will all remember the 2022 housing market as one of the most volatile that Metro Vancouver has ever seen, rising to unprecedented highs early in the year only to fall to a near 40-year low by December. Along the way the year crushed every cliché in the residential market. January and February sales, normally the slowest sales months of the year, were among the strongest. September, traditionally a stellar month, posted lower sales than August.

Year-over-year sales fell about 50% but prices proved amazingly resilient, with a mere 3.3% decrease in the benchmark composite home price. Most strata prices increased. And, to cap it all off, the normally sedate December posted a sales-to-new-listing ratio of more than 100% to put an exclamation point on an unforgettable year.

It is all rather reminiscent of 2018, and for a similar reason: anti-demand government policies - – including seven consecutive interest rate increases in 2022 – putting the brakes on eager buyers. The one major difference from 2018, sellers were far more absent as new listings were far more scarce.

We all must deal with continued government intervention in 2023, none of which address the underlying problem of a lack of supply in Metro Vancouver’s housing market. The shortage of both resale listings and new home construction was starkly apparent in December 2022, when total listings of homes was down 41% compared to a year earlier and new listings plunged 60% from November 2022. 

At the same time, starts of new non-rental homes in Metro Vancouver fell to 13,950 units as of December 1, down from 17,708 in the same period in 2021. And the government’s response to this dramatic shortfall? The complicated new and largely unnecessary B.C. Land Owner Transparency Registry, which  became mandatory on November 30 on residential purchases and require a lawyer’s assistance to complete;  a two-year federal ban on foreign homebuyers, which began January 1, 2023 and will discourage new speculative construction as immigration levels reach record highs; and B.C.’s unnecessary three-day cooling off period for homebuyers, effective January 3, 2023, in a market where the average listing now takes 31 days to sell. While giving buyers 3 days to decide if they want to move forward, it doesn’t technically allow for due diligence by a buyer and imposes a penalty on buyers if they want to rescind. As well, several Metro municipalities are increasing development cost charges on new home construction, even as developers are reeling from higher construction costs and land prices and slowing pre-sales of new strata units. 

When you consider what this market deals with, its resiliency is amazing and quite encouraging as we enter a new year, especially for homebuyers. The bottom line is that, with more than 50,000 new immigrants expected to arrive in B.C. in 2023 and governments pushing to stunt the housing supply, Metro Vancouver home prices will continue to face upward pressure.

December was likely a harbinger of what is to come. With just 1,240 new listings in the month, there were 1,303 sales, resulting in a sales-to-new-listing of a startling 105%. This is not indicative of slowing demand or owners desperate to sell.

We’ve not seen new listings for the month of December this low going back as far as 1991 in Greater Vancouver. If anyone thinks sellers are panic selling, this suggests the exact opposite and sets up 2023 to be a year with a skinny selection in front of hungry buyers. While the story of the real estate market tends to be the lack of sales that occurred in the second half of 2022, the drop in listings is the true underlying theme in the real estate market.

December benchmark prices are also an eye-opener. Despite all the angst in 2022, the forecasts of recession and a crash in values, average home prices are virtually the same now as 12 months ago. The overall average composite home price in December was $1,183,802, only $57,000 (or 4.2%) below the near-record price a year earlier. Some markets and housing types have higher average prices now than 12 months ago, including the bellwether Westside of Vancouver, where condo apartment prices have increased $30,000 and the East Side of Vancouver, where average townhouse prices in December were up about $120,000 from the end of 2021.

Based on current trends, 2023 looks like more of the same: gently rising home prices against a background of increased demand and a tight supply. Without more listings on the market, the true strength of this emerging buyer’s market will not be fully realized.

Here’s a summary of the numbers:

Greater Vancouver:

This is a balanced market, with only a low supply keeping it from tipping to a full-blown buyer’s market. Total units sold in December were 1,303 and total new listings were 1,240, resulting in a 105% sales-to-new-listing ratio, one of the highest in all of 2022. New listings were down 61% from November 2022 and 38% lower than in December 2021, which hampered many buyers. More listings would have resulted in higher sales, without a doubt. The low supply assured prices would remain constant, with the composite benchmark price in December at $1,131,600, down less than $20,000 from December 2021. With a further 55,000 international immigrants expected to arrive in 2023, listings in short supply and rents at record highs, the price pressure on homes is becoming intense.

Vancouver Westside:

This is the most-watched housing market in B.C. and it provides all the evidence needed that we are heading into a buyer’s market, with eager purchasers held in check only by a lack of supply. Despite an average price of nearly $3,489,1341 in December, 78% of new listings for detached houses sold. In the condominium apartment market, the sales success ratio was 114% and the average price of $993,400 was 3.1% higher than both a month and a year earlier. The townhouse sector saw December sales sag to 16, largely because new listings dropped to just 28 units, the lowest monthly level in at least two years. Still, the average Westside townhouse price in December was $1,566,761, the highest since July 2022.  The supply of total residential listings is still at 8 month’s supply, representing perhaps an irresistible buyer’s market as we head into 2023.

Vancouver East Side:

Next year is when it all comes together for the East Side housing market. The Broadway Plan is pushing density higher from Renfrew Street to Mount Pleasant with the new SkyTrain Subway as the development of the 450-acre False Creek Flats and its new St. Paul’s Hospital kick into high gear. Relaxed zoning allows three housing units on each detached lot and rental rates are soaring. Heady times indeed and savvy buyers and investors have started early. In December, 38 detached houses sold, representing 103% of the new listings available. Yet the average detached house price, at $1,766,997, is the lowest since December 2020 and half the price as the neighbouring Westside. Condos are also attractive for East Side buyers: the sales-to-new-listing ratio in December was 97% and the benchmark price has barely budged (down 0.5%) from a year ago. This is the market to get into now, while there is seven-month supply of homes available and prices are holding steady. We doubt that will be the case three months from now. 

North Vancouver

The overall sales-to-listing ratio in December was a startling 132% and there is only a 4-month supply of listings on the market, setting the stage for a very competitive market. Total sales were down 45% from a year earlier, to 107, but new listings dropped 32% year-over-year and were down nearly 70% from November 2022. The condo market is a sector to watch. The Lonsdale Quay/ Lower Lonsdale area is now a destination and was responsible for many of the 1,208 North Vancouver condo sales in 2022. Benchmark condo prices at $756,000 in December are up 1.6% from a year ago but have been declining an average of 1.5% per month since the spring. Be careful shopping in the new pre-sale strata market in North Vancouver City and District, which have brought in the Step 5 (net-zero) building code, which adds expenses and delays due to new super-energy-saving construction. All homes are in short supply, with just 385 active listings as of the end of December, down from 529 a month earlier. 

West Vancouver:

Total housing sales in December, with 40 transactions, were down 34% from December of 2021 but up from the 28 sales in November 2022. Active listings were 448 at month end, but new listings in December were down 58% from November and 6% lower than a year earlier. This market is defined by its detached housing, which posted an impressive 124% sales-to-new-listing ratio in December as 26 houses sold at an average price of just slightly under $3 million. The supply of total residential listings is down to an 11 month’s supply (buyer’s market conditions) and the sales to listings ratio of 85% compares to 25% in November 2022. This is a buyer’s market but don’t expect dramatically lower prices. The overall December benchmark, at $2,559,400, was still nearly 19% higher than in pre-pandemic 2019.

Richmond:

If any market will feel the brunt of the two-year foreign homebuyer ban it will likely be Richmond, but the ban is rather toothless because of exceptions to the federal legislation in force from Jan. 1, 2023. Foreigners with a spouse or common-law partner who is a Canadian are exempt as the spouse or partner would be the purchaser, as are permanent residents (those who have immigrated but are not yet citizens), foreigners with temporary work permits, refugees and most long-term international students can take advantage of exemptions depending on their situation. December sales in Richmond, at 171, were the lowest in three months and down 56% from December 2021. But there is a good selection for buyers, with 919 total listings at month’s end, compared to 723 a year ago. The benchmark price for a detached house is $1,978,200, down nearly 3% from November 2022. A total of 96 townhouses sold in December at a benchmark of $1,049,800, a price unchanged from three months earlier. Condo apartment sales benchmarked at $689,400, up 6% from December 2021. With a sales-to-listing ratio at 99% and a 5-month supply of listings, this is a balanced market.

Burnaby East:

This sub-market posted just 12 sales in December, a small share of the 183 transactions across Burnaby in the month, but it also had the highest benchmark home price in the municipality, at $1,082,300. Detached house prices, benchmarked at $1,657,400, were down 5.1% from a month earlier and 6% lower than a year ago. Total active listings of 74 at month’s end were more than doubled a year earlier, but new listings dropped 62% from a month earlier. There is a 6-month supply, and the sales-to-new-listing is running at a quick 86%, up from 38% in November 2022.

Burnaby North:

Housing sales continue to track lower, with 78 December sales down from 92 a month earlier and 50% lower than in December 2021. Prices are holding fairly firm, however, with the condo apartment price at $692,500, up 2.7% from year earlier. (The sixth residential tower – 396 units – at Brentwood started in December after the first five towers sold out). This is overall a balanced market with a 5-month supply, but the sales-to-listing ratio of 111%, the highest in at least four years, and solid prices mark it as a seller’s advantage.

Burnaby South:

Most of Burnaby’s housing sales – 94 – were in the South in December and this may continue due to the explosion of condo construction in the Metrotown area. Sales were down 20% from November 2022 and 49% lower than in December 2021. Prices are sticky, though, with composite benchmark price at $ $965,300, virtually unchanged (down 1.1%) from a year ago. Detached house prices have held rock-steady for the year at $1,889,000, down 0.5% from December 2021. There are 344 total listings in this seller’s market, down from 425 in November 2022, and the sales-to-new-listing ratio is a robust 159%, one of the highest in Metro Vancouver.

New Westminster:

The Royal City remained a seller’s market in December, with a sales-to-new-listings ratio of 183% - up from 164% a year ago – and just a 4-month supply of homes on the market, with 219 total listings. A total of 53 properties sold in December, down 18% from November and 61% below December 2021. The detached house benchmark price is $1,402,600, down 4.3% from a year ago, but townhouse ($872,800) and condo apartment ($619,400) prices are up by same amount year-over-year. Incidentally, New Westminster’s new council has been moving to speed residential developments with some sharp new ideas on quicker approvals. A market to watch in 2023.

Coquitlam:

All Tri-Cities communities are raising or considering increases in development cost charges for residential development, so we will likely be seeing higher prices for new product in 2023. Meanwhile new listings in December were down 69% from November and active listings, at 452 at month’s end, were down from 582 a month earlier, while the sales-to-new-listing ratio is running hot at 107%. Total sales in December were 81, down 40% from November and 42% below December 2021. The composite home price in December, at $1,044,700 is down 3.1% from a year earlier, while detached house benchmarks have slipped down 2.6% year-over-year to $1,698,400, in what is considered a balanced market.

Port Moody:

Total sales in this seller’s market were 41 in December, up 24% from November and down a modest 7% from a year earlier. Active listings were at 155 at month’s end compared to 97 at that time last year and 194 at the end of November. But, with the sales-to-new-listing ratio at 98%, listings are disappearing. The composite home price is at $1,079,300, up 1% from December 2021. 

Port Coquitlam:

The small city has posted its 2023 fee increases, including for residential development, and they remain relatively modest (a multi-family rezoning amendment costs $2,500 plus $200 per unit for each of the first 20 units, as an example). In December 37 residential properties sold, down 65% from December 2021. The sales-to-new-listing ratio is 84%, a reflection of the very low new listings, with just 11 houses, 9 townhouses and 24 condos added to the market in December. This is tight seller’s market, with just a 4-month supply of total listings and the composite home price down just 0.5% from a year ago, at $886,300.

Pitt Meadows:

Pitt Meadows was a popular destination during the pandemic, and the housing market has kept strong this year. Only 23 properties sold in December, compared to 33 at the same time a year ago, but were higher than in both October and November 2022. A 57% drop in new listings month-over-month led to a blistering 191% sales-to-new-listing ratio in December, the highest in years. With just a 2-month supply on the market, the composite benchmark home price is down 8.1% from a year ago at $853,400, but it could increase if the supply remains tight

Maple Ridge:

At $1,666,600 the benchmark price of a detached house dropped 15.4% in December compared to December 2021, the biggest year-over-year price decline in Metro Vancouver. Still, with sales of 78 in December and new listings down 65% from a month earlier, the sales-to-new-listing ratio was 120%, compared to 50% in November this is considered a balanced market. But buyers may start looking, as the composite home price is now $915,800, down 24.6% from six months ago.

Ladner:

Total units sold in December were 9, down from 16 (-44%) in November 2022 and down from 21 (-57%) in December 2021. Benchmark prices are lower across the board, with detached houses down 12.3% from six months ago at $1,299,400; townhouses down 11.2% from June 2022 at $880,200; and condo apartments selling in December at a benchmark of $670,400, about 9% lower than six months ago, but still 34% higher than in pre-pandemic 2019.

Tsawwassen:

With 23 sales in December, transactions were 47% below the same month last year and the composite home price fell 13.4% from six months ago and was down 4.4% year-to-year at $1,143,900. Overall home prices are still 26% above pre-pandemic December 2019. Active listings were 130 at month’s end compared to 68 at that time last year and 150 at the end of November 2022. The sales-to-new-listing ratio is a robust 115% in this balanced market, but slowing sales indicate further price corrections could be coming.

Surrey:  

Sales continue to tumble in B.C.’s second-largest city. Detached house sales fell nearly 70% in December from the same month a year earlier and were down 13.6% compared to November, to 102. The benchmark detached house price is feeling the sales slump, dropping 8.5% year-over-year to $1,510,400. Condo apartment sales plunged a stunning 79% from December 2021 and townhouse sales are down 69% year-over-year, with prices down about 2.5% to $502,800 for condos and $812,200 for townhouses. Even with new listings coming down, we call this a buyer’s market because of the lower prices being seen in one of B.C.’s fastest-growing city.

Download December Sales and Listings Statistics Houses Townhouses Condos
Download December Sales and Listings Statistics All Regional
Download Stat Images

Kevin Skipworth
Partner/Broker and Chief Economist at Dexter Realty


Read

Sales and Listing Report for October 2022

“There is always a ray of light at the end of every dark tunnel.”

Tink

Positive signs emerge as buyers’ market strengthens

Highlights of the October Report

  • Lowest benchmark home price: New Westminster at $809,800

  • Highest number of Greater Vancouver sales since June 2022

  • Benchmark home price is down 9.2% from six months ago

  • North Vancouver average home prices up 8.5% from September

  • West Side detached house sales highest in six months

  • Immigration surge will drive housing demand higher

The October housing market in Metro Vancouver revealed an economic truism: ‘the cure for higher prices is higher prices’ and that cure is bringing local housing sales and starts back to balance after a rollercoaster year.

This has swung to a buyers’ market that is gaining momentum and may soon appear irresistible.

Cast your memory back to the misty past of 9 months ago, when the benchmark detached house price in Greater Vancouver was $2.04 million, multiple offers were more common than not, property sales were cresting over 3,400 a month and monthly new condo starts were running above 650 units.

Higher prices and interest rates changed everything.

By October 2022, the detached house price had fallen to $1.89 million, housing sales were down to 1,903 for the month and multiple offers are less common. New condo starts dropped 30% from February to just 458 in October as builders struggled with soaring land and construction costs. The only number higher is the mortgage rate, which has basically doubled after six increases, the latest on October 26.

We are now seeing the ramifications of higher prices and the news for home buyers is now quite positive.

There are now five Greater Vancouver mainland markets where the overall composite benchmark home price is below $1 million: New Westminster, Burnaby North, Port Coquitlam, Pitt Meadows and Maple Ridge. Six months ago there was 1.

Those seeking to buy a Greater Vancouver home in virtually any market now can expect to pay tens of thousands of dollars less than just a few months ago. The overall benchmark detached house price in October, for example, was $201,500 lower than in May; townhouse prices are $97,500 less expensive; and the benchmark condo apartment price is $52,600 below the level of six months ago.

While home prices have fallen by 9.2% in six months, the average mortgage rate has increased about 3%.

Meanwhile, easing land prices and construction costs promise to bring cancelled or delayed strata projects back to life, likely at lower prices.

Altus Group reports that the average commercial land prices in Metro Vancouver this year have fallen from a high of $4.7 million an acre in the second quarter to $3.3 million in the third quarter, according to preliminary data, which is a dramatic change. Demand for multi-unit residential development land has also fallen with the dollar volume down 50% year-over-year as of mid-2022, to less than $1 billion, while a slowdown in new strata buildings has led to less demand and lower costs for construction materials and labour.

Also, the 50-basis point increase in the Bank of Canada rate on October 26 is a signal that rate increases are slowing and may stop this year. The rate increase was widely expected to be even higher. On October 26,  Bank of Canada governor Tiff Macklem said, ” This tightening phase will draw to a close.”

With Canadian housing sales falling year-over-year and inflation fears easing, we may have seen the last interest rate hike for this year, perhaps even into 2023.

Then we have the rental pressure that may drive more tenants into homeownership and more condo investors into the market.

Right now, due to the continual shortage, average rental prices in Metro Vancouver are the highest in Canada. As one landlord confided recently, there is little incentive to improve rental stock because, without other options, most renters pay what the landlord feels the market can bear. New or renovated one-bedroom apartments in Vancouver are now asking rents of $3,000 per month, which is enough to cover a $600,000 mortgage.

At this rate, it is now, or soon will be, less expensive to buy an apartment than to rent one. This, in turn, will encourage more investors to purchase a condo to place on the rental market, especially if the provincial government, as planned, legislates that all Strata Corporations must allow rentals.

As well, with the federal government announcing that it wants to increase immigration numbers to 500,000 by 2025, the demand for housing in B.C. is only going to grow. In 2023 Canada hopes to see immigration at 465,000, with skilled labour being a focus.

Governments now realize it must work on supply to increase housing – demand side measures just aren’t going to cut it anymore.

What we have today is a leaner and less mean residential market that should draw nimble buyers back into action and allow listings to increase as sellers and developers become more confident. We can thank higher prices earlier this year.

Here is a look at regional markets for October 2022

Greater Vancouver: Total housing sales in October, at 1,923, were 13% higher than a month earlier and the highest for any month since June 2022, yet still down 45% from October 2021. Compared to October 2021, townhome sales are 49% lower, condo sales 46% lower, and detached home sales down 52%. Detached house sales made up 30% of all transactions in October, while townhouses had a 17% share. Apartment sales accounted for the bulk of the market, with 52% of sales. Total sales were 33% below the 10-year average for the month. The overall average (not benchmark) price for all residential properties was $1,231,759. This is down about $110,000 from the peak in February 2022 and approximately $10,000 below the average price in October 2021. (Average prices often give a raw and accurate example of market performance.)  Active listings were at 10,305 at month end compared to 8,492 at that time last year and 10,424 (down 1%) at the end of September. New listings in October were down 5% compared to September 2022, down 0.5% compared to October 2021. Month’s supply of total residential listings is down to 5 month’s supply, considered a balanced market, but leaning towards a buyer’s advantage. October’s sales-to-listings ratio of 47% compared to 39% in September 2022 and 86% in October 2021. What’s really telling is that in October 2018 when sales were at a similar level as this October, new listings were 19% lower this October compared to 2018.

Fraser Valley: The Fraser Valley saw 901 total residential sales in October, down 53.5% from a year earlier, but up a scant 0.4% from September 2022. October ended with a total active inventory of 5,642 properties for sale, up 63.7% compared to October 2021. With a sales-to-active listings ratio of 16 per cent, this is a buyer’s market for the fifth straight month. Benchmark detached house prices are down just 0.8% from a year earlier and off 1.8% from September 2022, at $1,436,400.  At $809,800, the benchmark townhouse price decreased 1.5% compared to September 2022 and increased 7.7% compared to October 2021. Condo apartments sold at a benchmark of $527,900, down 0.5% compared to September 2022, but up 11.5% compared to October 2021.

Note to landowners, including detached house owners and those with small acreages along the new SkyTrain corridor to Langley are seeing record-setting land prices. In October, a one-acre assembly near the planned 152nd Street transit station sold for $6.5 million.

Vancouver Westside: Despite all the angst and hand wringing, a look into the Westside detached housing scene – which, let’s be honest, is Canada’s bellwether market – shows October was a lot better than most would think.  The 73 detached sales in the month represented 50% of the new listings last month – the highest sales-to-listing ratio since February – and the average sold price was $3,494,589. Fairly impressive. Total residential sales in October were 342, down 43% from a year earlier but up 14% from September 2022. Condo apartment sales led the October curve, posting 236 transactions at a benchmark price of $827,700, up 0.7% from September 2022, the first month-to-month price increase in at least 6 months.  Townhouse prices have been rising for three months, to reach a benchmark of $1,477,700 in October. With an overall sales-to-listing ratio of 40% or a 7 month supply availalbe, the Westside is close to a balanced market, but we see an opening for buyers in this aspirational community.

Vancouver East Side: Total detached house sales in October were down a startling 51% from a year earlier to just 56 houses, the same as in Coquitlam. But the East Side detached house price was less than in Coquitlam. In fact, it is less expensive to buy a house on the East Side than in any suburban market except Maple Ridge-Pitt Meadows, Port Coquitlam or South Delta. East Side house prices now cost 11.5% less than 6 months ago, and we think, at a benchmark of $1,719,100, they offer perhaps the best value in the Lower Mainland. East Side condo apartment prices are now benchmarked at $678,900 and have been declining an average of 1% per month for six months. East Side benchmark townhouse prices in October were 2% lower than a year ago, at $1,028,500. Total East Side housing sales in October were 194, up 9% from a month earlier. The sales-to-listing ratio is running at 44%, fairly healthy, and there is about a 6 month supply of listings in this balanced market.

North Vancouver: A total of 195 residential properties sold in October, up a thundering 52% from September 2022, and the composite benchmark home price rose 0.8% month-over-month to $1,330,800. Detached house prices increased 1.5% from September to $2,124,600. With a 56% sales-to-listing ratio in October and the total inventory down to a 3 month supply, this is perhaps the strongest seller’s market in the Lower Mainland.

West Vancouver: Only 47 residential properties sold in October, up from 42 a month earlier but 48% less than in October 2021. This is a buyer’s market for those who aspire to live in one of Canada’s wealthiest neighbourhoods. There is a generous 13 month supply of homes on the market, 589 in all, and the sales-to-listing ratio is a low 22%, about the same as in October 2018, which was one of the slowest months on record. Despite all this, the composite home benchmark price in West Vancouver is $2,732,300, up 1.1% from September 2022 and nearly 2% higher than a year ago. The typical detached house sold in October for $3,317,500, also slightly higher than in September 2022.

Richmond: Richmond will likely see an influx of buyers, especially from Hong Kong, which has already sent a huge flow of residents this year. Total home sales in Richmond shot up 16% from September to 243 in October though they were down from 49% from the hectic pace of October 2021. The composite home benchmark price has declined 6.6% over the past six months to settle at $1,121,200 in October. There is just a 5 month supply of homes on the market, and the sales-to-listing ratio is a healthy 53%. This is technically a balanced market, but buyers and investors should be paying attention.

Burnaby East: Burnaby East, which borders New Westminster, has the lowest benchmark detached house price in Burnaby, at $1,826,700, but it also has the fastest rising house prices in the municipality. In October detached prices were up 2.3% from a month earlier and 7.6% higher than a year ago. This is a smaller market, with just 22 total residential transactions in October, but this was up 47% from October 2021, a rare increase for any Metro market. The supply of total residential listings is down to 3 month supply and the sales-to-listing ratio is 63% for the past two months. This is a seller’s market to watch.

Burnaby North: Some of the most amenity-rich condo projects in Canada are in North Burnaby’s Brentwood area – a new development will boast a 2.75-acre outdoor “beachfront” and running track plus an indoor bowling alley – so it is not surprising that condos sell well. Yet the benchmark condo price is $711,900, the lowest in Burnaby and well below the Greater Vancouver benchmark. Total residential sales in October reached 96, down 14% from September and 50% lower than in October 2021. Detached houses sold in October at $1,946,300, down 8% from six months earlier. Yet this is a seller’s market, with just a 4 month supply of listings and a sales-to-listing ratio of 48% in October.

Burnaby South: Burnaby South posted 122 housing sales in October, up 27% from a month earlier but 46% lower than in October 2021. The composite benchmark home price, at $1,064,300, has declined 10.3% over the past 6 months but remains 4.4% higher than a year ago. This is also a seller’s market, with a sales-to-listings ratio of 50% and only a 4 month supply of homes for sale as of October.

New Westminster: After a severe slump in September, housing sales rallied 6% in October to a still low 71 transactions. This compares with average sales of more than 166 per month in the same month one and two years ago. The low sales are a bit of a puzzle. The Royal City has proved a magnet for Millennials and the composite home price, at $809,800, is the lowest in Greater Vancouver. Condos led October sales, with 58 transactions at a median of $575,000, about $100,000 less than in neighbouring Burnaby. The Royal City also has SkyTrain service, a riverfront esplanade and a central location in the region so we expect sales will increase. Right now, it is technically a seller’s market with just a 4 month supply of listings and a sales-to-listing ratio of 49%, based on a tight inventory of just 310 homes for sale. But those looking at location and value may decide the city offers an advantage to buyers.

Coquitlam: In October, Coquitlam had more condos for sale (186) than every Greater Vancouver market except Burnaby and Vancouver, a reflection of the SkyTrain-linked strata developments on the Burnaby border. Coquitlam’s condo sales-to-listing ratio is a strong 59% and the median condo price in October was $638,000, third highest in the region. The 56 detached house sales in October were down nearly 50% from a year earlier, but the benchmark price was up 5% in the same period to $1,750,400. Townhouses are benchmarked at more than $1 million. With a total inventory of 619 listings and 3 months supply of listings, this is a seller’s market and has been for quite some time.

Port Moody: Total residential sales, at 44 in October, have not been this low for the month since October of 2018 and active listings, at 179, were down from 187 in September 2022. The composite home price was down 2% from September, and 8.6% lower than six months earlier, at $1,117,500 in October. With a sales-to-listing ratio of 54%, however, and a slim inventory of just a 4 month supply, this remains a seller’s market.

Port Coquitlam: This is one of the least-expensive housing markets in Greater Vancouver and the city saw sales rally in October as transactions increased 24% from September to 62 sales. This was down 49% from a year earlier, however, and the benchmark composite price continued a six-month slide to land at $917,000 in October, the lowest price in the Tri-City region. Active listings were at 187 at month end compared to 190 at the end of September.
This is a seller’s market with only a 3 month inventory at the current sales pace. Buyers, though, may consider PoCo an affordable option.

Pitt Meadows: With a current composite home price of $818,700, this small town attracts value-seeking buyers, including young families. With prices down 11% from six months ago, it will continue to be a draw. October total sales were up 5% from September to 21 transactions, but the total inventory of listings, at 107, and steep 25% drop in new listings in October from a month earlier means supply is limited. There is a 5 month supply of homes available so buyers should start looking early in this affordable market.

Maple Ridge: The benchmark price of a Maple Ridge townhouse in October was $732,000, but first-time buyers and young families should not get discouraged. In a recent search we found 9 active townhouse listings under $500,000, including some priced under $450,000. We also found more than a dozen condo apartments listed at less than $350,000, though the benchmark condo price is $525,500. A total of 99 sales were posted in October, down 14% from September, and the total inventory is a healthy 592, about double what it was a year ago. With a 6 month supply of listings and composite home prices down 17% in the past 6 months, this is a balanced market that is tilting sharply to a buyer’s advantage.

Ladner: Ladner’s new multi-family construction this year is mostly subsidized rentals, which won’t ease the tight inventory of market housing. With just 91 total listings on the market and a sales-to-listing ratio of 57%, supply is running low. In October, 21 residential properties sold at a benchmark of $1,110,600, a price up 0.6% from September, the first month-over-month price increase in at least six months. The detached house benchmark price, at $1,354,900, is 12.5% lower than in May 2022 but nearly unchanged (up 1%) from a year ago. With a 4 month supply of homes available, this is a seller’s market where prices are balancing.

Tsawwassen: The red-hot Southlands community helped drive sales and prices of townhouses in the area higher this spring, but prices have eased since. The benchmark Tsawwassen townhouse price in October was $1,218,400, still higher than in Richmond, Burnaby and even East Vancouver, but down 9.4% compared to 6 months earlier, when multiple offers were still being seen. Total home sales in October reached 28, up 33% from a month earlier but down 56% from October 2021. Detached houses are selling for $1,536,100, down 10.8% over the past six months. This is considered a balanced market with a 7 month supply of listings and a sales-to-listing ratio of 45% as of October.

Surrey: October sales of all types of homes were down sharply in October compared to a year earlier: detached sales fell 64.5% to 129 transactions; townhouse sales were down 52% and condo apartment sales dropped by 49.4% to just 146 units. Prices have stabilized, however, virtually unchanged from a month earlier. Detached houses sold in October at a benchmark of $1,584,100, up 2% from a October 2021; 128 townhouses sold at a $828,100 benchmark; and the condo apartment price was up 11% from a year earlier at $527,700. Still, with a huge inventory of homes listed and sales down at least 50% from a year ago, there are deals to be had. For instance, there were 111 active detached-house listings in Surrey priced at $900,000 or less and 24 condo apartments listed at $275,000 or less as this Dexter report was put together.

Kevin Skipworth, Partner/Broker and Chief Economist at Dexter Realty

Read
Reciprocity Logo The data relating to real estate on this website comes in part from the MLS® Reciprocity program of either the Greater Vancouver REALTORS® (GVR), the Fraser Valley Real Estate Board (FVREB) or the Chilliwack and District Real Estate Board (CADREB). Real estate listings held by participating real estate firms are marked with the MLS® logo and detailed information about the listing includes the name of the listing agent. This representation is based in whole or part on data generated by either the GVR, the FVREB or the CADREB which assumes no responsibility for its accuracy. The materials contained on this page may not be reproduced without the express written consent of either the GVR, the FVREB or the CADREB.