Highlights of Dexter’s July 2024 report
High interest rates have slowed the economy and real estate sales
Active listing counts climbed again this month
Second highest number of new listings in July since 2008
Buyer opportunities abound in the market
For the past 10 years we’ve all been asking for more listings in the real estate market… well we are finally seeing it. We have more listings, now what are we going to do it them? And as they say, opposites attract. With fewer sales and a noticeable increase in listings, the opposite of last year in the first 6 months – we could see this opposite attract more buyers to the market in the last half of 2024, attracted to the opportunities that are out there.
Let’s talk economics. The Bank of Canada made their second consecutive interest rate drop in July, seeing their rate decline to 4.5%. And with economic data abound pointing to a sluggish economy here in Canada and the U.S., expect that trend to continue through the remainder of 2024. South of the border, their Federal Bank has been more patient, and it is beginning to appear that this patience has come at a cost. Data out of the U.S. is pointing to an economy slowing quickly, resulting in a pull back in the stock market and bond yields falling quickly in both Canada and the U.S. – think fixed rate mortgages. After hitting a high of 4.46% in 2023 the 5-year Canada bond rate is down to 2.9%. The U.S. Federal Bank announcement is in September and expect their first rate cut to happen with successive rate cuts to follow that. Will that make a difference to buyer sentiment? With the increase in listing inventory allowing for more opportunity, prices are showing signs of weakness which could create one of the best buying opportunities we’ve seen in many years in Metro Vancouver. The second half of 2024 should be one of those years where the number of sales in the back half are more than the first.
There were 2,333 properties sold in Greater Vancouver in July, after seeing 2,418 sold in June, 2,733 sold in May, 2,831 sold in April and 2,415 properties sold in March this year. There hasn’t been much variance in buyer activity in 2024, consistently patient would be the best way to describe it. This was a 5% decrease from the 2,455 properties sold last year in July after a 19% decrease in June from the 2,988 properties sold in June 2023. Comparing to last year isn’t exactly comparing apples to apples. Last spring there was a feeling that rate cuts were on the horizon and much like Lucy pulling out the football on Charlie Brown, the Bank of Canada cranked up rates in June and July. After that the market went quiet, buyers were noticeably absent. This spring, it felt more like buyer sentiment was “fool me once, shame on you, fool me twice, shame on me.” Buyers weren’t ready to fall for the story line of more interest rate cuts. But the neon sign is flashing that they are coming, and more likely faster than anticipated.
Sales in July were 18% below the 10-year average after June was 24% below the 10-year average and May being 20% below the 10-year average. Not much changed on that front, this is a market where demand is building and waiting for the signal to buy. Trends are like 2019 where an influx of listings in the spring lead to stronger sales in the last half of the year. And after experiencing mortgage shock of the stress test in 2018 which negatively impacted the borrowing power of buyers, the demand that built up through 2018 and into 2019 started to come back into the real estate market.
While the number of new listings dropped in July compared to August, the absorption rate remained relatively flat. Dropping slightly to 41% in July, after being at 42% the previous two months, the growth in active listings was slower. Likely due to several listings coming off the market as the patience of some sellers gave out. Greater Vancouver is still sitting at 6 months of inventory (on the border of balanced to buyer’s market). North Vancouver, New Westminster, Port Moody, Ladner and Pitt Meadows are the only cities at 4 months supply – technically a seller’s market. This is mainly due to falling total inventory counts in those areas while other cities saw total actives continue to increase in July. West Vancouver continues to be one of the only markets in Greater Vancouver showing to be a buyer’s market with its current sales activity and listing inventory. Make no mistake though, there are some areas and types of properties that are a buyer’s market.
Once again new listing totals declined in Greater Vancouver in July. After seeing 7,229 in April, 6,484 new listings in May, 5,851 new listings in June, the total for July was 5,689. It seems markets throughout North America experience this trend with more listings hitting the market, so Metro Vancouver was not alone. It helps to create a healthier balance in the market and while other locations are experiencing steeper price declines, Metro Vancouver is remaining relatively flat, with the House Price Index only down 0.8% month-over-month in Greater Vancouver. Whistler, Squamish and the Sunshine Coast are experiencing higher price declines, down 2%, 1.9% and 3.7% month-over-month respectively and down 7.7%, 3.3% and 2.8% respectively in the last year.
For the fourth straight month, the number of new listings declined month-over-month, but July still produced more than last year. In July 2023 there were 4,757 new listings, 16% fewer than July of this year. So far 2024 has proven to show that pent up supply is finally coming to the market. After the end of July, the total number of new listings for the year is 76% of the total that came out in 2023. Expect to see fewer new listings come to the market in the last half of the year though, as it typically the case and likely more sellers playing the wait and see game.
The number of new listings in July were 12% above the 10-year average after seeing June at 2% above the 10-year average, May at 7% above the 10-year average and April at 29% above the 10-year average. In fact, the month of July saw the second highest number of new listings for the month since 2008. While trending lower, sellers are still far more active in the real estate market than buyers.
There were 14,326 active listings in Greater Vancouver at month end, compared to 14,180 at the end of June and 13,600 at the end of May. The growth of active listings has slowed significantly after being up 46% year-over-year at the end of May, currently sitting 39% higher than this time last year. Some sellers are simply refusing to participate in the market and taking their homes off the market after failing to attract a buyer at a price they are prepared to sell for. Some sellers are content to be on the market, while others would prefer to be sold. While not quite at the highs of 2019 when there were close to 16,000 active listings in May that year, this increase in listings is positive for the real estate market and should help to keep prices relatively flat if further interest rate decreases pull buyers back into the market.
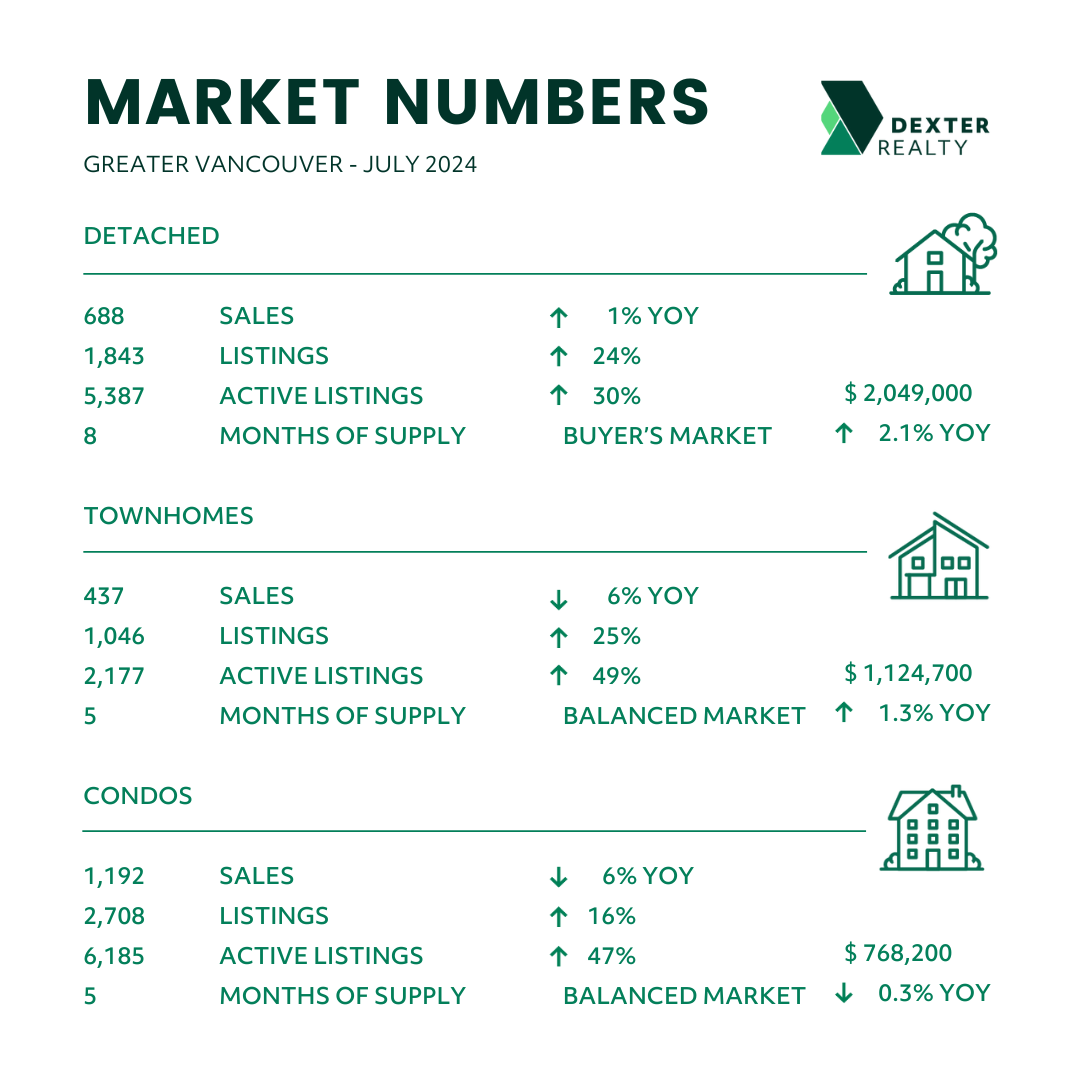
Looking at the different types of homes, detached active listings are up 30% year-over-year, while townhouses are up 49% and condos are up 47%. Since the end of March though, detached active listings are up 41%, while townhouses are up 38% and condos are up 32%. With new home starts down significantly and rental projects being the focus of many developers, we’ll continue to see supply constraints in the strata ownership market in the years to come. This could be the best time to get into that market.
The detached market overall in Greater Vancouver remains at 8 months supply while townhomes and condos stayed with 5 months supply keeping it in that mix of seller’s to balanced market conditions in Greater Vancouver. The tighter supply continues to be in North Vancouver where there are only 3 months supply of townhomes and condos, Richmond, Ladner, Tsawwassen, Pitt Meadows and Maple Ridge townhomes at 3 months supply and townhomes in Port Moody with only 2 months supply.
The autumn real estate market is setting up for one of interest rate declines and an economy in need of stimulation. The cracks are showing, have federal banks waited too long? It is beginning to appear that the 3 remaining Bank of Canada meetings could all lead to reductions in their interest rate with fixed rates following. Great news for buyers and many sellers who have been looking to sell this year.
Here’s a summary of the numbers:
Greater Vancouver: Total Units Sold in July were 2,333 – down from 2,418 (4%) in June, down from 2,733 (15%) in May, down from 2,455 (5%) in July 2023, up from 1,904 (23%) in July 2022, down from 3,375 (31%) in July 2021, down from 3,202 (27%) in July 2020, and down from 2,584 (10%) in July 2019; Active Listings were at 14,326 at month end compared to 10,301 at that time last year (up 39%) and 14,180 at the end of June (up 1%); New Listings in July were down 2% compared to June 2024, up 20% compared to July 2023, up 40% compared to July 2022, up 26% compared to July 2021, down 7% compared to July 2020, and up 20% compared to July 2019. Month’s supply of total residential listings is steady at 6 month’s supply (balanced market conditions) and sales to listings ratio of 41% compared to 42% in June 2024, 52% in July 2023, and 47% in July 2022.
Month-over-month, the house price index is down 0.8% and in the last 6 months up 2.6%.
Vancouver Westside: Total Units Sold in July were 416 – down from 470 (11%) in June, down from 501 (17%) in May, down from 438 (5%) in July 2023, up from 368 (13%) in July 2022, down from 570 (27%) in July 2021, down from 472 (12%) in July 2020, and down from 489 (15%) in July 2019; Active Listings were at 3,040 at month end compared to 2,366 at that time last year (up 28%) and 3,069 at the end of June (down 1%); New Listings in July were down 3% compared to June 2024, up 11% compared to July 2023, up 37% compared to July 2022, up 25% compared to July 2021, 11% compared to July 2020, and up 28% compared to July 2019. Month’s supply of total residential listings is steady at 7 month’s supply (balanced market conditions) and sales to listings ratio of 37% compared to 40% in June 2024, 43% in July 2023, and 44% in July 2022.
Month-over-month, the house price index is down 0.9% and in the last 6 months up 3.1%.
Vancouver East Side: Total Units Sold in July were 263 – down from 270 (3%) in June, down from 329 (20%) in May, down from 286 (8%) in July 2023, up from 198 (33%) in July 2022, down from 360 (27%) in July 2021, up from 344 (8%) in July 2020, and down from 277 (5%) in July 2019; Active Listings were at 1,468 at month end compared to 1,082 at that time last year (up 36%) and 1,491 at the end of June (up 2%); New Listings in July were down 8% compared to June 2024, up 18% compared to July 2023, up 36% compared to July 2022, up 22% compared to July 2021, down 14% compared to July 2020, and up 26% compared to July 2019. Month’s supply of total residential listings is steady at 6 month’s supply (balanced market conditions) and sales to listings ratio of 44% compared to 42% in June 2024, 57% in July 2023, and 45% in July 2022.
Month-over-month, the house price index is down 1.2% and in the last 6 months up 2.8%.
North Vancouver: Total Units Sold in July were 201 – down from 221 (9%) in June, down from 245 (18%) in May, up from 185 (9%) in July 2023, up from 173 (16%) in July 2022, down from 252 (20%) in July 2021, down from 267 (25%) in July 2020, and down from 205 (2%) in July 2019; Active Listings were at 740 at month end compared to 530 at that time last year (up 40%) and 793 at the end of June (down 7%); New Listings in July were down 7% compared to June 2024, up 37% compared to July 2023, up 42% compared to July 2022, up 42% compared to July 2021, down 14% compared to July 2020, and up 16% compared to July 2019. Month’s supply of total residential listings is steady at 4 month’s supply (seller’s market conditions) and sales to listings ratio of 47% compared to 48% in June 2024, 59% in July 2023, and 57% in July 2022.
Month-over-month, the house price index is down 1.0% and in the last 6 months up 3.3%.
West Vancouver: Total Units Sold in July were 59 – down from 75 (21%) in June, down from 67 (12%) in May, up from 47 (26%) in July 2023, up from 47 (26%) in July 2022, down from 83 (29%) in July 2021, down from 68 (13%) in July 2020, and the same as July 2019; Active Listings were at 733 at month end compared to 603 at that time last year (up 22%) and 716 at the end of June (up 2%); New Listings in July were the same as June 2024, up 16% compared to July 2023, up 45% compared to July 2022, up 36% compared to July 2021, up 9% compared to July 2020, and up 41% compared to July 2019. Month’s supply of total residential listings is up to 12 month’s supply (buyer’s market conditions) and sales to listings ratio of 27% compared to 35% in June 2024, 25% in July 2023, and 35% in July 2022.
Month-over-month, the house price index is down 1.2% but in the last 6 months up 3.3%.
Richmond: Total Units Sold in July were 255 – down from 263 (3%) in June, down from 299 (15%) in May, down from 294 (13%) in July 2023, up from 223 (14%) in July 2022, down from 429 (41%) in July 2021, down from 363 (30%) in July 2020, and down from 301 (15%) in July 2019; Active Listings were at 1,563 at month end compared to 1,185 at that time last year (up 32%) and 1,482 at the end of June (up 5%); New Listings in July were up 12% compared to June 2024, up 18% compared to July 2023, up 47% compared to July 2022, up 4% compared to July 2021, up 2% compared to July 2020, and up 3% compared to July 2019. Month’s supply of total residential listings is steady at 6 month’s supply (balanced market conditions) and sales to listings ratio of 40% compared to 46% in June 2024, 54% in July 2023, and 52% in July 2022.
Month-over-month, the house price index is down 0.7% and in the last 6 months up 1.0%.
Burnaby East: Total Units Sold in July were 33 – up from 17 (94%) in June, up from 31 (6%) in May, up from 25 (32%) in July 2023, up from 22 (50%) in July 2022, down from 46 (28%) in July 2021, up from 32 (3%) in July 2020, and up from 14 (136%) in July 2019; Active Listings were at 160 at month end compared to 88 at that time last year (up 82%) and 163 at the end of June (down 2%); New Listings in July were down 22% compared to June 2024, up 62% compared to July 2023, up 91% compared to July 2022, up 11% compared to July 2021, down 7% compared to July 2020, and up 40% compared to July 2019. Month’s supply of total residential listings is down to 5 month’s supply from 10 (balanced market conditions) and sales to listings ratio of 52% compared to 21% in June 2024, 64% in July 2023, and 67% in July 2022.
Month-over-month, the house price index is down 0.9% and in the last 6 months up 4.1%.
Burnaby North: Total Units Sold in July were 137 – down from 172 (20%) in June, down from 166 (17%) in May, down from 160 (14%) in July 2023, up from 124 (10%) in July 2022, down from 197 (30%) in July 2021, down from 141 (3%) in July 2020, and up from 132 (4%) in July 2019; Active Listings were at 837 at month end compared to 481 at that time last year (up 74%) and 761 at the end of June (up 10%); New Listings in July were up 6% compared to June 2024, up 36% compared to July 2023, up 63% compared to July 2022, up 46% compared to July 2021, up 44% compared to July 2020, and up 69% compared to July 2019. Month’s supply of total residential listings is up to 6 month’s supply from 4 (balanced market conditions) and sales to listings ratio of 35% compared to 46% in June 2024, 55% in July 2023, and 51% in July 2022.
Month-over-month, the house price index is down 0.4% and in the last 6 months up 2.3%.
Burnaby South: Total Units Sold in July were 140 – up from 135 (4%) in June, up from 127 (10%) in May, up from 139 (1%) in July 2023, up from 126 (11%) in July 2022, down from 202 (31%) in July 2021, up from 114 (23%) in July 2020, and down from 152 (8%) in July 2019; Active Listings were at 682 at month end compared to 457 at that time last year (up 49%) and 699 at the end of June (down 2%); New Listings in July were down 14% compared to June 2024, up 17% compared to July 2023, up 36% compared to July 2022, up 3% compared to July 2021, down 11% compared to July 2020, and up 17% compared to July 2019. Month’s supply of total residential listings is steady at 5 month’s supply (balanced market conditions) and sales to listings ratio of 50% compared to 42% in June 2024, 59% in July 2023, and 61% in July 2022.
Month-over-month, the house price index is down 0.5% and in the last 6 months up 1.5%.
New Westminster: Total Units Sold in July were 98 – down from 108 (9%) in June, down from 115 (15%) in May, down from 119 (18%) in July 2023, up from 82 (20%) in July 2022, down from 163 (40%) in July 2021, down from 164 (40%) in July 2020, and down from 122 (20%) in July 2019; Active Listings were at 428 at month end compared to 304 at that time last year (up 41%) and 433 at the end of June (down 1%); New Listings in July were down 3% compared to June 2024, up 13% compared to July 2023, up 41% compared to July 2022, up 4% compared to July 2021, down 25% compared to July 2020, and up 5% compared to July 2019. Month’s supply of total residential listings is steady at 4 month’s supply (seller’s market conditions) and sales to listings ratio of 47% compared to 50% in June 2024, 64% in July 2023, and 55% in July 2022.
Month-over-month, the house price index is down 0.5% and in the last 6 months up 1.5%.
Coquitlam: Total Units Sold in July were 178 – down from 179 (1%) in June, down from 228 (22%) in May, down from 223 (20%) in July 2023, up from 142 (25%) in July 2022, down from 292 (39%) in July 2021, down from 287 (38%) in July 2020, and down from 236 (25%) in July 2019; Active Listings were at 1,047 at month end compared to 636 at that time last year (up 65%) and 961 at the end of June (up 9%); New Listings in July were up 10% compared to June 2024, up 23% compared to July 2023, up 77% compared to July 2022, up 47% compared to July 2021, up 17% compared to July 2020, and up 15% compared to July 2019. Month’s supply of total residential listings is up to 6 month’s supply from 5 (balanced market conditions) and sales to listings ratio of 35% compared to 42% in June 2024, 55% in July 2023, and 50% in July 2022.
Month-over-month, the house price index is down 0.3% and in the last 6 months up 1.2%.
Port Moody: Total Units Sold in July were 58 – up from 56 (4%) in June, the same as May, down from 85 (32%) in July 2023, up from 45 (29%) in July 2022, down from 93 (38%) in July 2021, down from 96 (40%) in July 2020, and up from 56 (4%) in July 2019; Active Listings were at 238 at month end compared to 186 at that time last year (up 28%) and 241 at the end of June (down 1%); New Listings in July were down 16% compared to June 2024, up 1% compared to July 2023, up 35% compared to July 2022, up 35% compared to July 2021, down 2% compared to July 2020, and up 49% compared to July 2019. Month’s supply of total residential listings is steady at 4 month’s supply (seller’s market conditions) and sales to listings ratio of 52% compared to 42% in June 2024, 77% in July 2023, and 54% in July 2022.
Month-over-month, the house price index is down 0.3% and in the last 6 months up 4.5%.
Port Coquitlam: Total Units Sold in July were 66 – up from 62 (6%) in June, down from 95 (31%) in May, down from 73 (10%) in July 2023, down from 71 (7%) in July 2022, down from 103 (36%) in July 2021, down from 119 (45%) in July 2020, and down from 86 (23%) in July 2019; Active Listings were at 331 at month end compared to 172 at that time last year (up 92%) and 313 at the end of June (up 6%); New Listings in July were down 5% compared to June 2024, up 34% compared to July 2023, up 20% compared to July 2022, up 50% compared to July 2021, down 4% compared to July 2020, and up 8% compared to July 2019. Month’s supply of total residential listings is steady at 5 month’s supply (balanced market conditions) and sales to listings ratio of 40% compared to 36% in June 2024, 60% in July 2023, and 52% in July 2022.
Month-over-month, the house price index is down 0% and in the last 6 months up 3.3%.
Pitt Meadows: Total Units Sold in July were 27 – down from 28 (4%) in June, down from 30 (10%) in May, up from 24 (13%) in July 2023, up from 22 (23%) in July 2022, down from 39 (31%) in July 2021, down from 48 (44%) in July 2020, and up from 20 (35%) in July 2019; Active Listings were at 108 at month end compared to 74 at that time last year (up 45%) and 97 at the end of June (up 11%); New Listings in July were up 31% compared to June 2024, up 54% compared to July 2023, up 48% compared to July 2022, up 97% compared to July 2021, up 15% compared to July 2020, and up 42% compared to July 2019. Month’s supply of total residential listings is steady up to 4 month’s supply from 3 (seller’s market conditions) and sales to listings ratio of 38% compared to 51% in June 2024, 52% in July 2023, and 45% in July 2022.
Month-over-month, the house price index is down 0% and in the last 6 months up 3.4%.
Maple Ridge: Total Units Sold in July were 166 – up from 130 (28%) in June, down from 172 (3%) in May, up from 143 (16%) in July 2023, up from 108 (54%) in July 2022, down from 188 (12%) in July 2021, down from 246 (33%) in July 2020, and down from 182 (10%) in July 2019; Active Listings were at 879 at month end compared to 622 at that time last year (up 41%) and 889 at the end of June (down 1%); New Listings in July were down 4% compared to June 2024, up 19% compared to July 2023, up 22% compared to July 2022, up 44% compared to July 2021, down 7% compared to July 2020, and up 6% compared to July 2019. Month’s supply of total residential listings is down to 5 month’s supply from 7 (balanced market conditions) and sales to listings ratio of 48% compared to 36% in June 2024, 50% in July 2023, and 38% in July 2022.
Month-over-month, the house price index is down 0.3% and in the last 6 months up 3.3%.
Ladner: Total Units Sold in July were 31 – up from 27 (15%) in June, down from 33 (6%) in May, up from 26 (19%) in July 2023, up from 13 (138%) in July 2022, down from 39 (21%) in July 2021, down from 49 (37%) in July 2020, and down from 34 (9%) in July 2019; Active Listings were at 138 at month end compared to 102 at that time last year (up 35%) and 140 at the end of June (down 1%); New Listings in July were down 12% compared to June 2024, down 9% compared to July 2023, up 29% compared to July 2022, up 66% compared to July 2021, down 26% compared to July 2020, and down 10% compared to July 2019. Month’s supply of total residential listings is down to 4 month’s supply from 5 (seller’s market conditions) and sales to listings ratio of 58% compared to 45% in June 2024, 45% in July 2023, and 32% in July 2022.
Month-over-month, the house price index is down 0.4% and in the last 6 months up 2.5%.
Tsawwassen: Total Units Sold in July were 45 – up from 44 (2%) in June, up from 40 (13%) in May, up from 33 (36%) in July 2023, up from 28 (61%) in July 2022, down from 58 (22%) in July 2021, down from 62 (27%) in July 2020, and down from 46 (2%) in July 2019; Active Listings were at 206 at month end compared to 161 at that time last year (up 28%) and 224 at the end of June (down 8%); New Listings in July were down 15% compared to June 2024, up 11% compared to July 2023, up 27% compared to July 2022, up 9% compared to July 2021, down 45% compared to July 2020, and the same as July 2019. Month’s supply of total residential listings is steady at 5 month’s supply (balanced market conditions) and sales to listings ratio of 63% compared to 52% in June 2024, 52% in July 2023, and 50% in July 2022.
Month-over-month, the house price index is up 1.2% and in the last 6 months up 3.2%.
Fraser Valley: Sales in July were down 6.6%, compared to June and were down 10.1% from July 2023. New listings were down 0.2% from June and up 19.5% from July 2023.The average price was up 0.4% month-over-month and is up 0.8% year-over-year. Active listings were up 4.6% to 8,731 from 8,350 last month and up 40.8% from July 2023 which was at 6,199. Month’s supply of total residential listings is up to 6 month’s supply (balanced to buyer’s market conditions).
“Amidst an overall balanced market, some REALTORS® are experiencing pockets within the Fraser Valley that favour buyers, where prices have come down,” said Jeff Chadha, Chair of the Fraser Valley Real Estate Board. “This is evident in the amount of time buyers have to view a property before considering making an offer. Properties that are well-priced are selling quickly, suggesting motivated buyers are active in the market despite the slowdown.”
Month-over-month, the house price index is down 0.5% and in the last 6 months up 0.1%.