
“If you have the courage to begin, you have the courage to succeed.”
David Viscott
So you need to buy a home. Now is a good time to do so.
There have always been challenges purchasing in one of the most expensive housing markets on the planet. It is still possible, though, to find the home or investment of your dreams in Metro Vancouver, and despite the headwinds, this is actually a good time to be purchasing, with the help of an experienced and connected real estate company.
The main challenge is finding a home to purchase.
The big question in today’s Metro Vancouver housing market is not ‘where will the new supply’ come from?’ but ‘why is there such a shortage of homes for sale?’ especially in an environment where buyer demand and price increases are at such a feverish pitch.
This past month we have seen houses and townhouses sell within days for well over the asking price. It is not uncommon for a single listing to attract a dozen or more offers.
The demand is coming from conventional buyers wanting to buy their first home or trying to move up to investors and families hoping to buy a second or perhaps a third property as a smart hedge against the highest inflation rate in more than 30 years. But let’s not forget, the investment properties become rentals for a starved rental market and allow developers to build more supply.
Caught in the headlights of this traffic is homeowners who are fearful that if they sell, they won’t be able to purchase a similar or better home because of the shortage of listings and the amazing price parity being seen across the region.
In January, for example, the benchmark price of a detached house was the almost exactly same on Bowen Island – $1.48 million – as in North Delta at $1.45 million. A typical townhouse sells zin Squamish, at $936,000, the same as the average price in the Fraser Valley. At just under $600,000, a Sunshine Coast condo apartment is priced at the same level as in New Westminster or Ladner or Cloverdale. This is the time when a great buyer’s agent is very much worth working with.
Why buy now?
- Low mortgage rates are a prime reason to move into the market as soon as you can.
The first step is to get a pre-approved mortgage. It is no secret that lending rates will be rising this year, likely with the first Bank of Canada increase coming by March. Lock in a pre-approval home loan at today’s historical low rates, good for 90 days, right now. - Restrictions coming: If you are an investor or are buying a second home, there is a very strong chance that the federal government is about to increase the down payment required, in a bid, it says, to curb speculation.
Currently, about one in four homes in Canada is purchased as an investment. With home prices in Metro Vancouver rising about 25% over the past year, investing in real estate is naturally more popular here than in most of the country. - Federal housing minister Ahmed Hussen said in a January statement: “By developing policies to curb excessive profits in investment properties … and reviewing the down payment requirements for investment properties, we are targeting the issues the market is facing from multiple angles.”
Today, an investor can buy a home with a 20% down payment, but this could be increased to 25% or even higher. It is better to buy that investment condo, perhaps a suite for the university student in the family, or other secondary home now before tighter restrictions kick in. - Then there is appreciation. The BC Real Estate Association forecast in January that the average home price in Metro Vancouver, now at $1.2 million, would increase a further 8.1 per cent this year, compared to 2021, and rise again by 3.2% by 2023. This means that a typical buyer could make at least 10% or about $120,000 in appreciation over the next two years. Across the province the composite home price is predicted to top $1 million this year for the first time.
- Little competition: Finally, there is little fear of the Metro Vancouver housing market seeing a huge increase in supply. Listings of homes for sale have been declining for months and hit an all-time low in January as just 4,251 homes were added to the market, 19th lowest amount for the month of January. However, 2,329 homes sold, the third-highest for January sales in history.
- Despite all the government pledges to increase the supply of homes, total housing starts in Metro Vancouver last year reached 26,103 units while immigration to the area totaled more than 35,000 people. One of the barriers to new detached house construction in Metro Vancouver is that average municipal fees and taxes on a new house which now total $199,000, according to a survey released by the Homebuilders Association of Vancouver in January.
Short story is that when you buy a home this month, it will likely have little competition when you go to sell it or rent it. B.C. has only 425 housing units per 1,000 people in a country that has among the lowest average housing supply per capita in the G7. The Metro Vancouver rental vacancy rate is around 2% and the rental costs are the highest in Canada.
Unnecessary costs and delays continue to hurt supply and contribute to the added price of housing. In January, a local developer lamented that they have waited five years for building approval from the City of Vancouver on a project that includes 20% below-market homes around the SkyTrain. And while the city delayed building permits, they were also being charged $250,000 in annual Empty Home Taxes. This can make affordable rental projects financially unviable.
Highlights of this Report:
- Why now is the time to buy. Really.
- Only market where townhouse prices dropped from December 2021: Vancouver East Side (down 3% after a 21.5% increase in the previous 12 months) – expect that to swing the other way in the months to come as lack of available townhouses push prices up again.
- Greater Vancouver benchmark home price appreciation year-over-year: $234,900
- Biggest year-over-year detached house price increase: Surrey, up 43%
- Biggest year-over-year detached house sales decline: Surrey, down 38%
A summary of the January numbers:
Greater Vancouver:
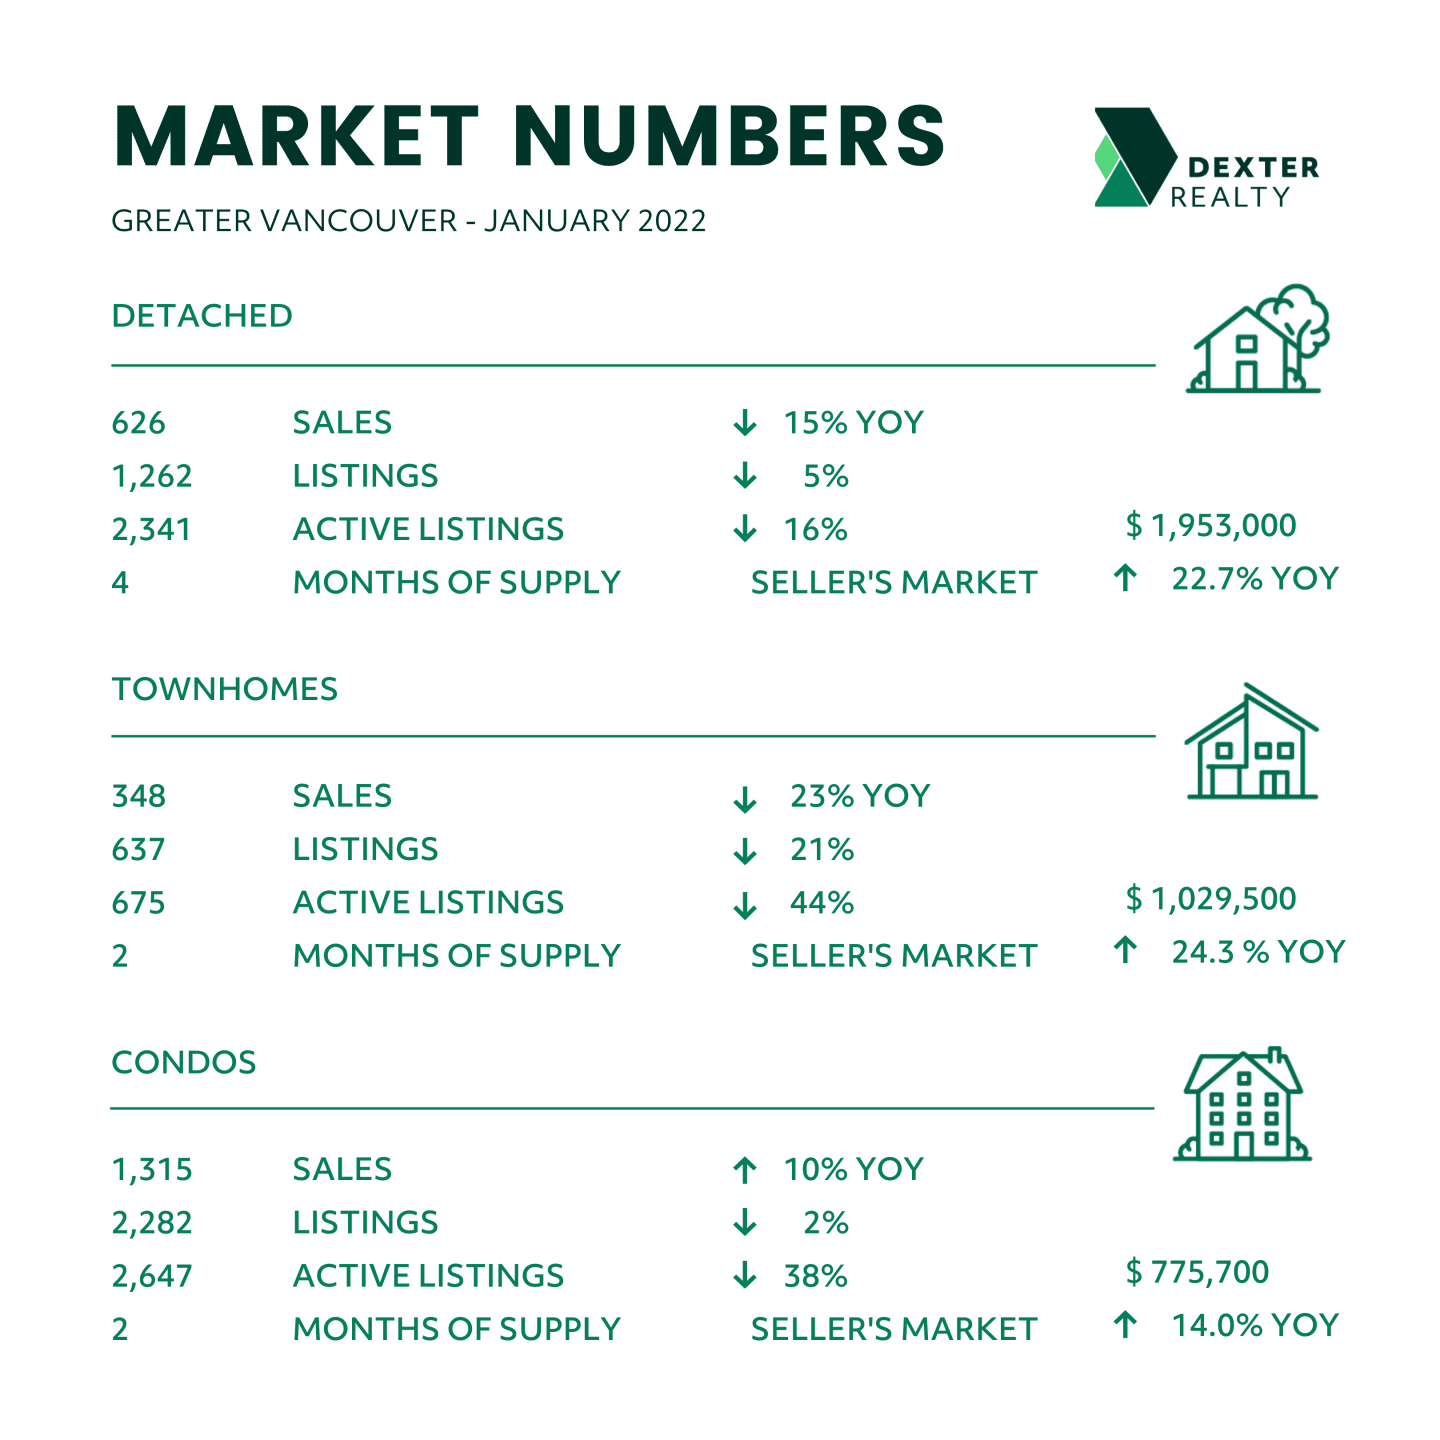
Total housing sales for the first month of 2022 were 2,329, which was down 15% from December and 5% lower than in January of last year.
But the slow sales are linked to a lack of inventory: active listings for the month reached just 5,987 properties, compared to 8,831 at that time last year and 5,588 at the end of December 2021. New listings in January were down 8% compared to January 2021, though up 6% compared to January 2020. The result was a sales-to-listing ratio of 55%, the highest for a January in two years, and sharply higher prices. The composite residential benchmark price in January – which combines all property types was $1,272,000, up 2% from a month earlier and 18.5% higher than in January 2021. This is a staggering annual cash increase of $234,900. The typical detached house sold in January for a record benchmark high of $1,953,000, up 22.7% – or $438,000 – from a year earlier. This level of performance is the best evidence of why there is such an insatiable demand for Greater Vancouver housing. Total housing starts across all of Metro Vancouver in 2021 were 26,013 homes, up just 3,000 starts from 2020. It is the townhouse sector that is seeing the highest demand and price growth, with a year-over-year increase of 24.3% in January to $1,029,000. Yet only 236 new townhouses began construction in January and 186 of these were in Surrey and Langley.
As January ended, the inventory of total residential listings was at a 3-month supply, signaling the seller’s market will continue.
Fraser Valley:
The Fraser Valley Real Estate Board processed a total of 1,310 sales of all property types on in January 2022, a decrease of 23.7% compared to January 2021, and 27.5% lower compared to December 2021. The Board received 2,135 new listings in January, an increase of 67.1% compared to December 2021, and a decrease of 23.3% compared to January of last year. Total active listings for the month were 2,332, down 44.6% compared to January 2021, however an increase of 19.2% compared to December 2021. Fraser Valley benchmark prices are up sharply, year over year. At $1,569,300, the benchmark price of a detached house increased 41.8%; the townhouse benchmark is up 37.2% to $796,500; and the typical condo price has increased 30.6% from a year ago to $574,300.
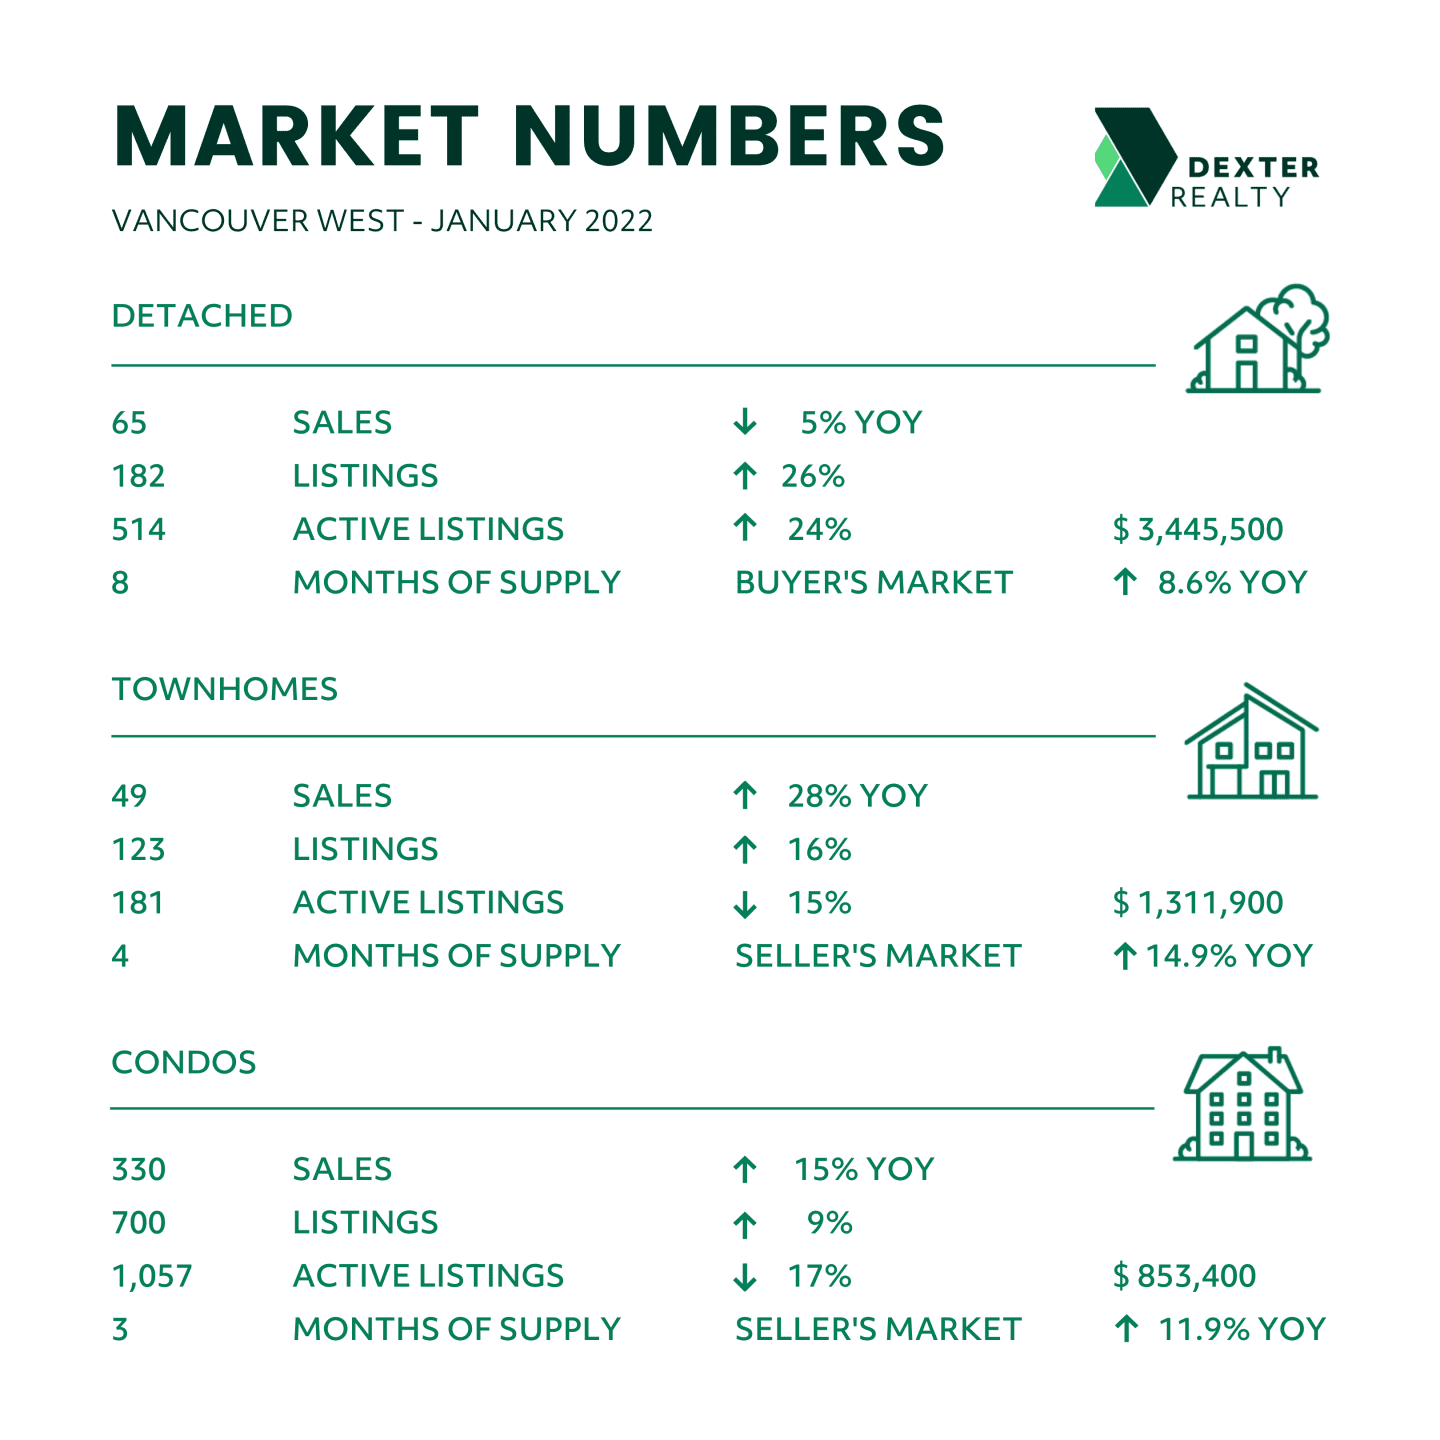
Vancouver Westside:
There was a modest January listing rally for Westside townhouses, a property species that has been hunted to near extinction. New listings rose to 123, compared to just 47 in December 2021, and the benchmark price increased 15% from a year earlier to $1,311,000, based on 49 sales. But only 68 townhouses started construction on the Westside during all of 2021 and no townhouses started on the Westside in January 2021. If you own a Westside townhouse and have considered listing, it would likely attract multiple offers this month. The benchmark price for a detached house on the Westside is now $3,445,400, yet an average of more than two houses sold every day during January, trailing only Richmond for the highest house sales in Greater Vancouver. Condo apartment sales dominated the buyer action on the Westside in January, however, with 330 transactions at a median price of $856,000 and a sales-to-listing-ratio of 47%.

Vancouver East Side:
A total of 257 residential properties sold in January, unchanged from the same month a year earlier and up 13% from December 2021.
This included 65 detached houses that sold for a benchmark price of $1,805,100, which was 2% higher than in December 2021 and up 16.8% from a year earlier.
Total new listings in January were down 5% compared to January 2021. The overall sales-to-listings ratio of 54% compared to 51% in January 2021. The sales-to-listings ratio for townhouses is 59%, yet the benchmark townhouse price dipped 3% from December 2021 to $1,053,400 in January, the only Metro sub-market to post a month-over-month price decline in townhouse prices. Of course, the 21.5% increase in the previous 12 months may have had something to do with this. Expect more price gains to come.

North Vancouver:
North Vancouver joined the $2 million house price club in January as the benchmark detached house increased 2.9% from a month earlier to $2,025,800. This may have spooked some buyers, as detached sales dropped to 37 transactions, down from 56 in December 2021, despite new listings rising to 74 houses, up from 25 a month before. The detached house and townhouse sales-to-new-listing ratio are both at 50%. In January, 59% of the 109 listings for condo apartments sold at a benchmark price of $695,000. Total new listings in January were down 24% compared to January 2021 in this seller’s market.

West Vancouver:
This remains an exclusive market, where the benchmark home price is among the highest in Canada at $2,605,000 in January, due to the dominance of detached houses, which now sell for a median of $3,080,000. West Vancouver home prices have remained fairly stable over the past year, inching up just under 1% per month. West Vancouver condos remain the most expensive in the Metro region, at a January benchmark of $1,151,200, based on a dozen sales. Total new listings in January were down 27% compared to January 2021. There is, however, a relatively healthy 8-month’s supply of total residential listings in what is one of the rare balanced markets in the region.

Richmond:
Richmond kept the real estate market active as sales were up 23% this January compared to January 2021, while they dropped in most other communities. Richmond detached house prices reached a benchmark of $2,032,000, remaining above the $2 million level for the second straight month. There were 108 detached sales in January, higher compared to both December 2021 and January of last year. Richmond posted the highest townhouse sales in Greater Vancouver in January, with 56 selling at a new record high of $1,027,300, up nearly 4% from December and 24% higher than a year earlier. Total new listings in January were down 7% compared to January 2021. The overall sales to listings ratio is 61% compared to 47% in January 2021 in this strong seller’s market.

Burnaby East:
Total housing sales in January were 25 – down from 32 (22%) in December 2021, down from 33 (24%) and from 28 (11%) in January 2021. Active Listings were at 34 at month end compared to 67 at that time last year and 32 at the end of December; New listings in January were down 19% compared to January 2021. The sales to listings ratio of 71% compares to 65% in January 2021. The composite home price is now $1,157,100, up 16.4% from January 2021 and 2.6% higher than in December 2021.
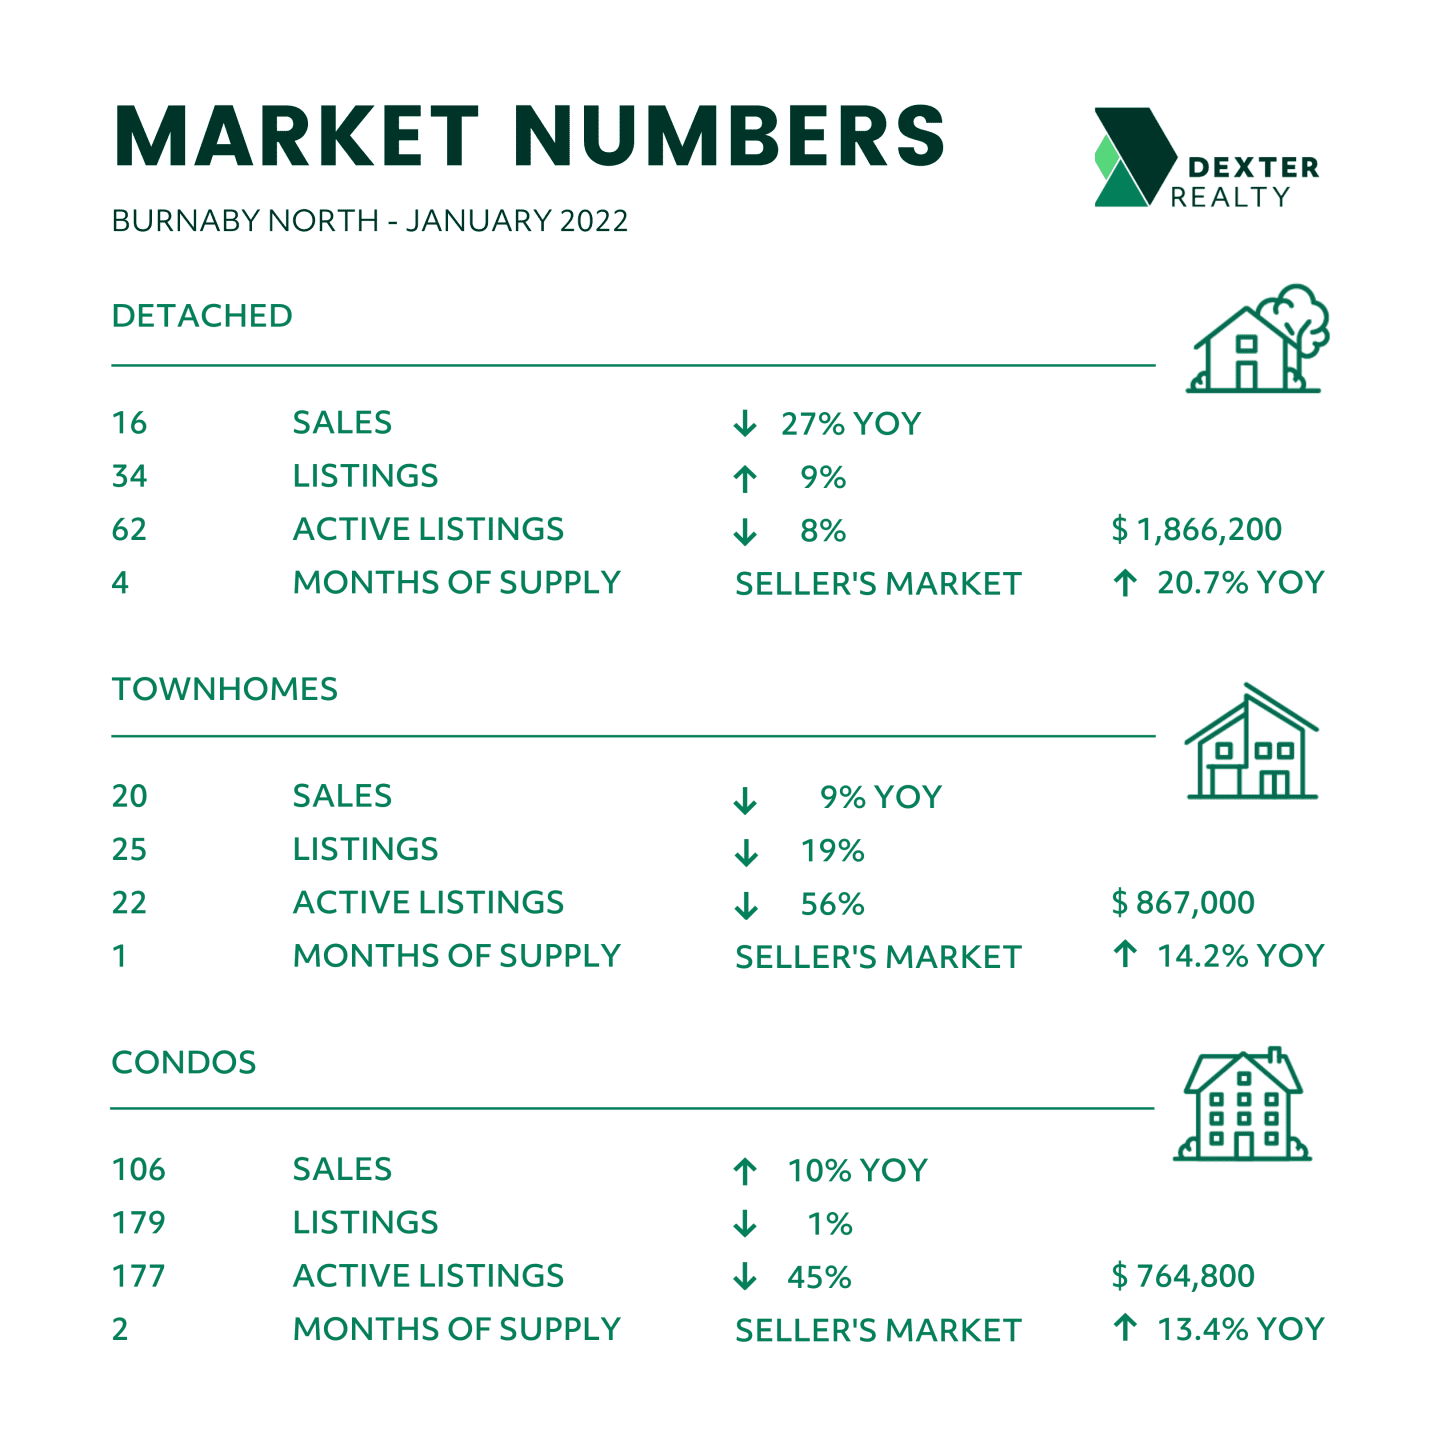
Burnaby North:
Total housing sales in January were 141, down from 157 (10%) in December 2021, and down from 144 (1%) in January 2021. Active Listings were at 262 at month end compared to 448 at that time last year and 229 at the end of December. New listings in January were down 2% compared to January 2021. The sales-to listings ratio is 60% compared to 59% in January 2021. As could be expected in a market where 2,514 apartments started construction last year, tower condos are very popular in Burnaby North, where the benchmark condo price is now $764,800, up 13.4% from a year ago.

Burnaby South:
After a slow 2020, a successful pre-sale condo launch late in 2021 spurred Metrotown land development action in January. The land prices give an indication of where new Burnaby South condo prices are heading. In January, a 1.4-acre site that falls under the new Metrotown Official Community Plan, which allows greater density, sold for more than $45 million: yes, that works out to about $32 million per acre for a site that could potentially developed into about 396,000 square feet of tower apartments. In January, condos in South Burnaby sold for a benchmark of $710,700, a price up 2% from a month earlier. Total new listings in January were down 7% compared to January 2021. The sales-to listings ratio was 62% compared to 55% in January 2021.

New Westminster:
The Royal City is the only community in Greater Vancouver where the composite benchmark price is under $1 million, because condo sales dominate transactions. The composite price was $773,600 in January, which was $500,000 below the Greater Vancouver benchmark of $1,255,200. The median price of a condo apartment, which accounted for nearly 80% of January sales, is $598,600; townhouses sell for $925,800; and the typical detached house sold in January for $1,419,000. Total new listings in January were down 22% compared to January 2021. The overall sales to listings ratio is 61% compared to 47% in January 2021.

Coquitlam: Coquitlam residential sales tallied 174 in January, down from 216 (19%) in December 2021 and down from 225 (23%) in January 2021 Active listings were at 299 at month end compared to 538 at that time last year and 267 at the end of December; New Listings in January were down 22% compared to January 2021. January’s sales-to-listings ratio of 66% was exactly the same as a year earlier. Price increases have been remarkable with the benchmark price of a detached house rising 26.9% from a year earlier to $1,675,000 in January and the overall composite home price up nearly 24% from a year earlier and 3.5% higher than in December 2021 to $1,203,100. Coquitlam was recently named the No. 2 best city in which to work in B.C. by BC Business magazine.
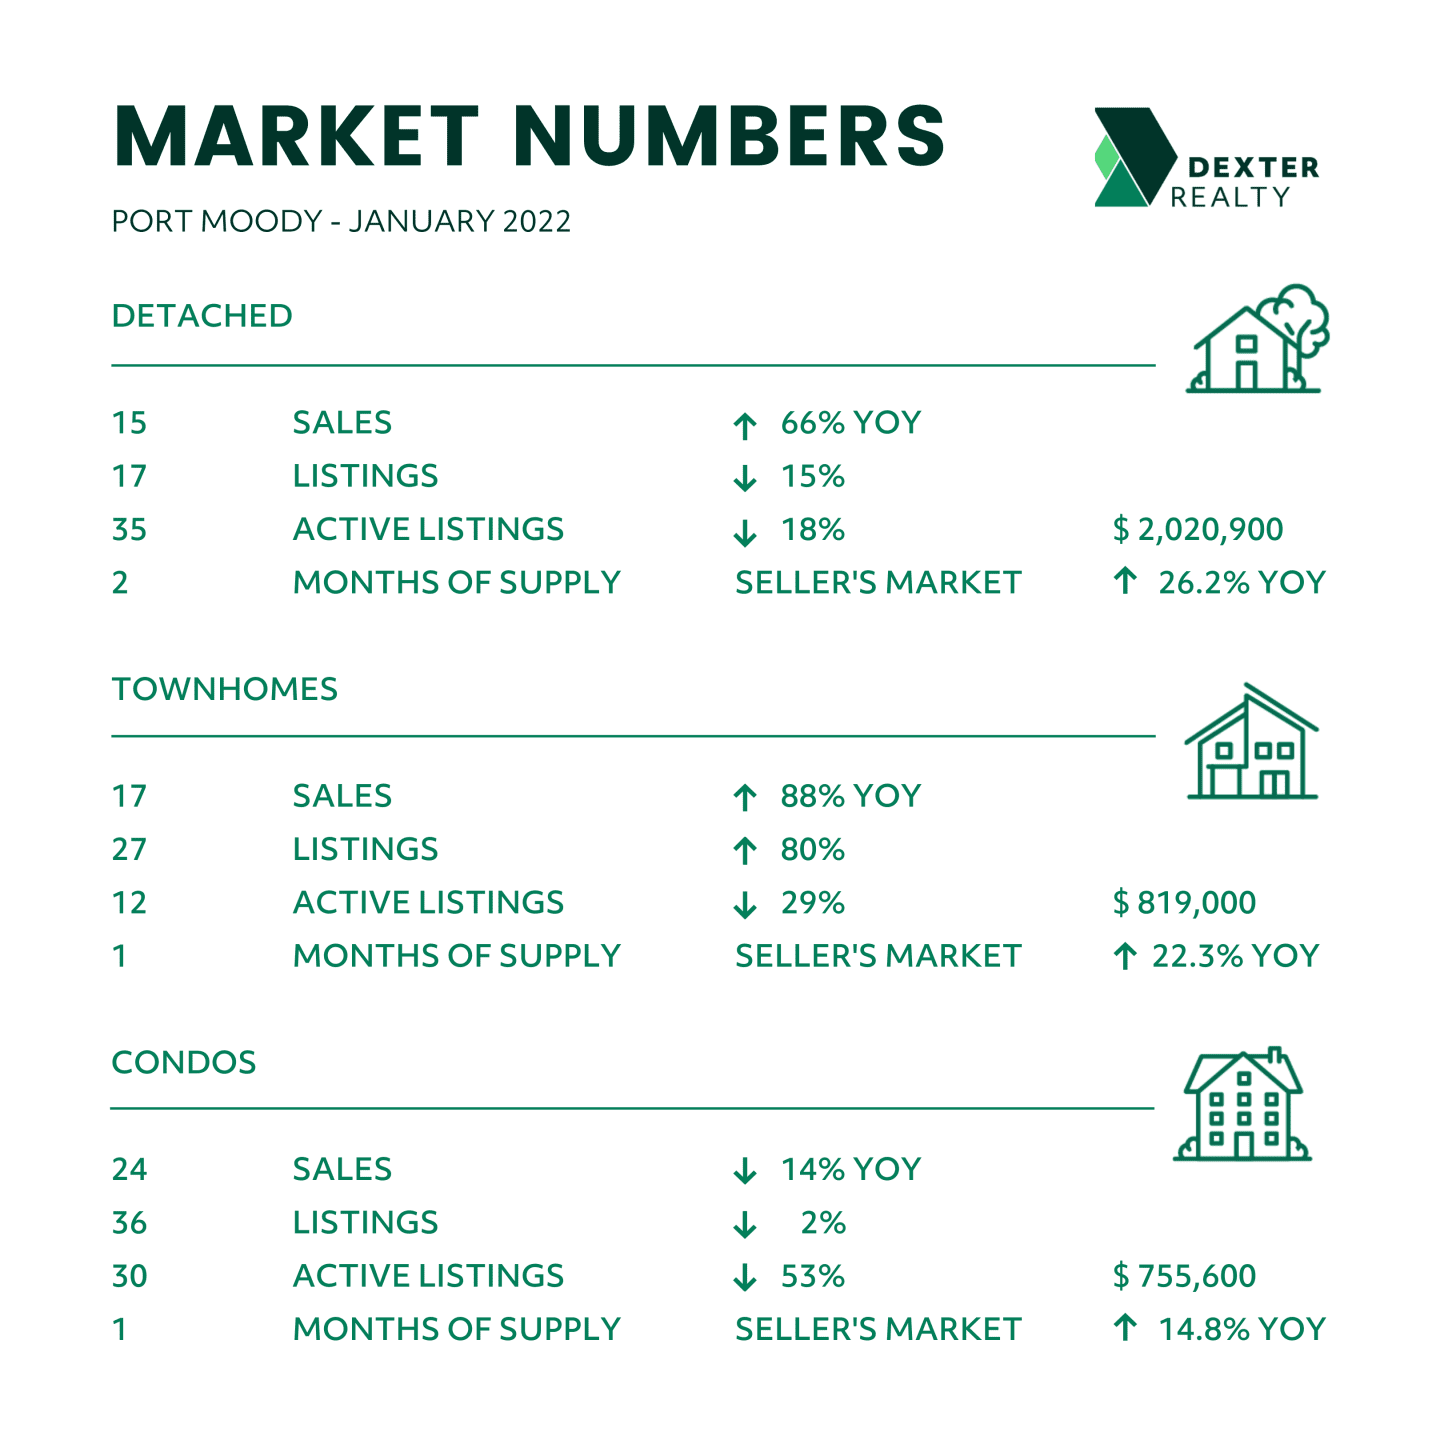
Port Moody:
Port Moody managed to see a slight increase in new listings this January compared to last year, but with 24% more sales. active listings dropped. Total units sold in January were 56, up from 37 in January 2021.; Active Listings were 93 at month end compared to 140 at that time last year and 97 at the end of December 2021. New Listings in January were up 5% compared to January 2021. The sales to listings ratio of 71% compared to 61% in January 2021. The most active sector in January was the condo market, with 24 transactions at a median price of $680,000.

Port Coquitlam:
Sales generally declined in January compared to December 2021, dropping 28% to 77 transactions. New listings in January were down 33% compared to January 2021 as the city got off to a slow start in the year of the Tiger. Despite the lull in action, the benchmark home price increased 27%, the biggest year-over-year increase in the Tri-Cities, to $1,022,500. There is only about a one-month supply of listing in Port Coquitlam and the sales-to-listing ratio of 73% is eating it up quickly

Pitt Meadows:
Once one of the most affordable communities in Metro Vancouver, the 2022 assessment value of a Pitt Meadow detached house rose 34% from a year earlier, from $843,000 to $1.13 million, for a hike of $283,000 for the typical house, according to BC Assessment data. The actual sale price of a detached house in January was even higher, at $1,432,600. Total sales in January were 30, nearly level with both January 2021 and December 2021. The sales to listings ratio of 73% compared to 70% in January 2021 in this seller’s market.

Maple Ridge:
Total units sold in January were 124 – down from 159 (22%) in December 2021, and down from 194 (36%) in January 2021, Active Listings were at 210 at month end compared to 342 at that time last year and 143 at the end of December; New Listings in January were down 4% compared to January 2021, and the sales to listings ratio of 51% compared to 77% in January of last year. The benchmark price of a Maple Ridge detached house posted one of the highest year-over-year increases in the Metro region, escalating 38% to $1,284,300 in January which may be the reason for decrease in sales in January comparative to last January.

Ladner:
With a remarkable 35.6% surge in the benchmark detached house price, compared to a year earlier, the typical Ladner house sold in January for $1,459,000, remarkable for such a small community. Total home sales in the month were 22, up 5% from December 2021 and 10% higher than a year earlier. New Listings in January were down 31% compared to January 2021, and the sales-to-listings ratio of 61% compared to 38% in January 2021. This a tight seller’s market.

Tsawwassen:
Total housing sales in sunny Tsawwassen were 42 in January, down 28% from January of last year and level with the sales in December 2021. The benchmark detached house price was up about 28% from year earlier at $1,561,600. Townhouse prices are up 21.5% in the same period to $936,600. New listings in January were down 13% compared to January 2021, and the sales-to-listings ratio of 54% compared to 60% in January 2021.
Surrey:
Watch for a major new multi-family housing developments in the Semiahmoo Town Centre of South Surrey, where Surrey council recently approved a plan that sets building height limits of up to 28-storeys. The plan also allows for a corridor of six-story buildings along 152 Street from 18 Avenue to 23 Avenue. Surrey, which has led new home construction over the past year, saw housing sales contract in January. Detached sales were down 33% from a year earlier; townhouse sales slid 35.4%, though condo apartment sales increased 20% to 291 units. The drop in detached house sales may be a reaction to a 43% surge in average prices from a year earlier to a new all-time high of $1,986,959 in January. Townhouse prices rocketed up nearly 44%, rising from $670,044 a year ago to $936,844 in January 2022.


.jpg?cc=1669270130020)