Highlights of Dexter’s August 2024 report
Detached home sales in August down 18% to July
Active listing counts declined except for Richmond, Coquitlam and Port Moody
Lowest number of monthly sales since January
Buyers ready for more interest rate cuts
August 2024 was the month of taking a break! With sales and listing activity down, it felt like most were enjoying the weather and holiday time before September rolled around. After a thrust of listings over the last 5 months, there was a significant decline for August that left fewer homes on the market as we move into the fall market.
For the third consecutive meeting the Bank of Canada has reduced its key interest rate by a quarter point, bringing down mortgage costs for homeowners with variable rate mortgages and lines of credit. While not overly expected, there was some thought that a half point reduction could have come. But what this does now is leave the remaining two meetings open to further reductions in the Bank of Canada’s rate as the economy and inflation numbers clearly are indicating that stimulus is needed. Even though the United States Feds seemed steadfast in keeping their rate unchanged for the remainder of 2024 earlier in the summer, they have now signalled that there will be a rate cut in September at their meeting on the 17th. Expect both countries to use the remainder of the year to reduce their rates, with Canada going from the current 4.5% to 3.75% or even 3.5% by the time 2025 begins.
Of course, fixed rate mortgages are affected by bond yields, and after hitting a high of 4.46% in 2023 the 5-year Canada bond rate then dropped down to 2.9% in July and is just over 3.0% now. This likely means fixed interested rates won’t see much change from the Bank of Canada interest rate cut in September as bond markets typically predict what’s going to happen and thus bond rates are priced accordingly. Meaning, everyone is expecting a rate cut. But as the fall moves forward expect fixed rates to see movement downward as the Bank of Canada is predicted to continue its downward trajectory. All this means, mortgage costs will come down, and buyers will have more incentive to go back into the market. And with 2025 coming, we’ll start to see 5-year mortgages come up for renewal that were locked in to record low rates. The disincentive to sell could be off the table for those with expiring “cheap rate” mortgages and create more transactional activity in the real estate market.
There were 1,903 properties sold in Greater Vancouver in August after 2,333 properties sold in July, 2,418 sold in June, 2,733 sold in May, and 2,831 sold in April. Buyers have signalled they want more interest rate relief with the total number of sales declining month over month for the fourth straight time. And they are about to get it. What will be the tipping point to move buyers back into the market at a greater pace? We’ll likely see that this fall. Sales in August were a 17% decrease from the 2,296 properties sold last year after a 5% decease in July from the 2,455 properties sold in July 2023, and a 19% decrease in June from the 2,988 properties sold in June 2023. Last summer buyers faced the shock of two sudden Bank of Canada interest rate increases which brought sales activity quickly down after a robust spring in 2023. To see sales levels at this level after two rate reductions points to a deep pool of buyers waiting. Economic uncertainty certainly weighs on the market with unemployment rates rising and overall spending being held in check. All signs point to a market that will see demand unleash, but it’s a question of when. Buyers are likely saying “Show me the rate reductions” before fully embracing this buyer’s market.
Sales in August were 26% below the 10-year average after July was 18% below the 10-year average and June was 24% below the 10-year average. This trend will be changing in the months ahead as buyers get behind interest rate reductions. Like 2019, the fall market will be more active than spring. We’ve seen an increase in listings albeit not as many as 2019, and how many listings come out in the fall will dictate where prices go over the next 6 months.
With the number of new listings dropping for the fourth straight month, the absorption rate increased to 45%, the highest percentage since March. Even with the lower number of sales, fewer listings were added to the overall active listing count. And with approximately 400 listings expiring at the end of August, that total dropped even more at the start of September. Greater Vancouver is pushed up to 7 months of inventory, closer to a buyer’s market, after being at 6 months and lower all year. All areas in Greater Vancouver have shifted into balanced to buyer’s markets after North Vancouver, New Westminster, Port Moody, Ladner and Pitt Meadows being the only areas in a seller’s market prior to August. This is mainly due to falling sales in those areas. Vancouver’s Westside and Richmond joined West Vancouver in buyer’s market territory due to their drop in total sales along with higher active listing counts. There may be areas and product types that act differently either with stronger activity or less activity. It’s not unusual to see multiple offers on Vancouver’s Westside detached while condo apartments downtown sit without any offers.
The number of new listings dropped again in August, the biggest month over month decline this year. After seeing 7,229 in April, 6,484 new listings in May, 5,851 new listings in June, 5,689 new listings in July, the total for August was 4,199.
While the number of new listings declined month-over-month, there were slightly more new listings in August this year compared to that month in 2023. In Augst 2023 there were 4,015 new listings, 5% more than August last year. August typically sees the real estate market less active, to it’s not completely surprising to see fewer new listings come on but after a higher number in July, it perhaps could be a trend of less seller activity through the remainder of 2024.
The number of new listings in August were 1.5% below the 10-year average, after seeing July at 12% above the 10-year average, June at 2% above the 10-year average, May at 7% above the 10-year average and April at 29% above the 10-year average. Even with the summer slowdown, August produced less listings than typical for this month.
There were 13,812 active listings in Greater Vancouver at month end, compared to 14,325 at the end of July and 14,180 at the end of June. After being up 46% year-over-year at the end of May, currently there are 37% more new listings year-over-year. After the end of August, September started with 13,444 with listings expiring at the end of August or sellers simply taking them off the market. In 2019, there was a similar pattern, with the active listing count going from 15,037 at the end of July to 14,191 at the end of August and continuing to decline for the remainder of the year to finish with 9,309. We’ve likely seen the number of active listings peak in 2024 and as we move through the remainder of the year, buyer choice will likely decline.
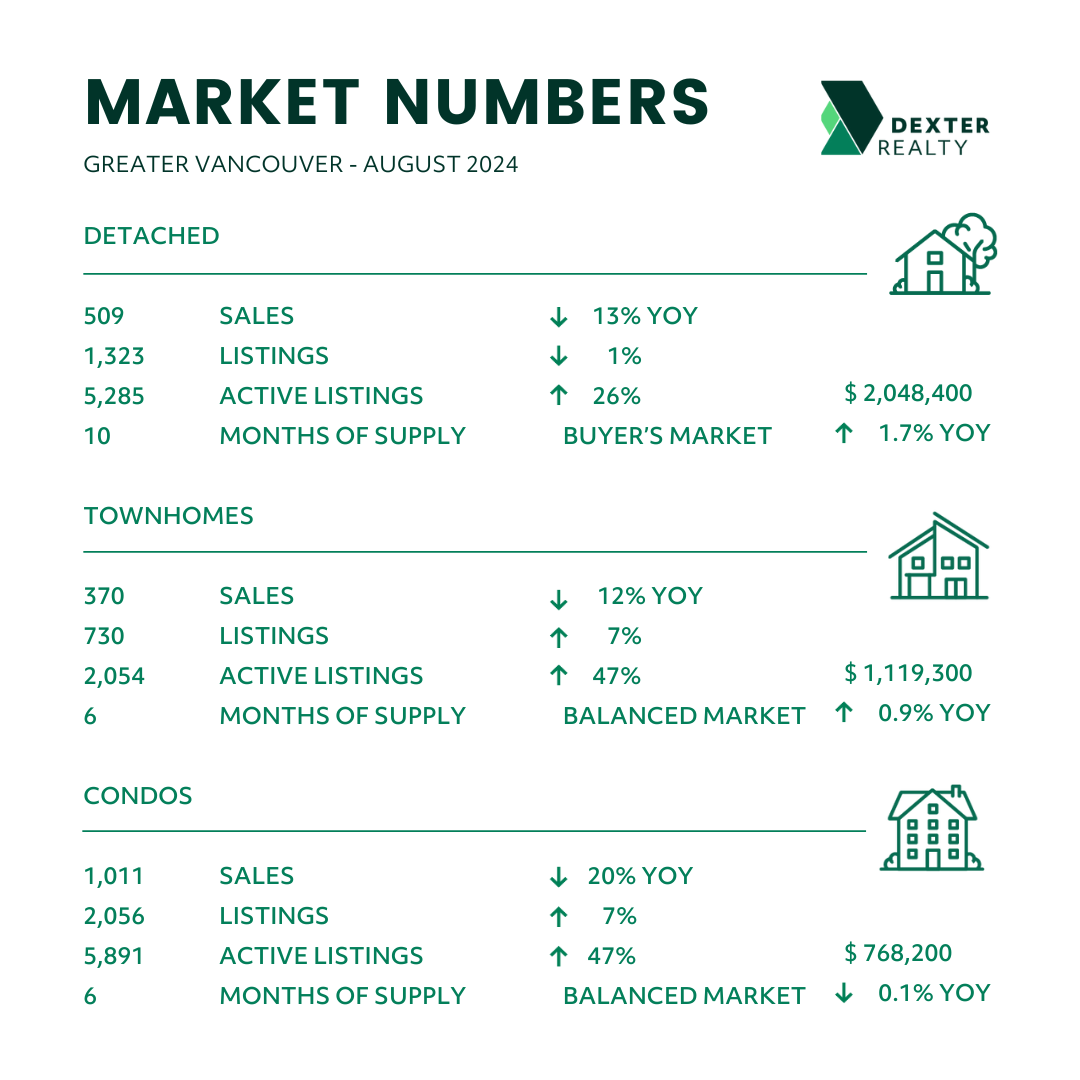
Overall the detached market in Greater Vancouver is up to 10 months supply from 8 while townhomes and condos both jumped up to 6 from 5 months supply making it a balanced to buyer’s market in the region. Detached homes are showing less buyer engagement while townhouses and condos are in some areas still in a seller’s market. With cost control on the minds of buyers, it’s not surprising to see lower priced properties being more attractive in the market.
The biggest movement in B.C. in August was the shift in the political landscape with the leader of the B.C. United party stepping his party away from the election race. It’s now a two-horse race. Housing is sure to be a significant part of the campaign for both parties, but will either party have a viable solution for increasing supply? For 8 years the NDP government has moved the needle very little even with significant regulatory and legislative changes to property rights and municipal zoning requirements. Investment in housing has been pushed away, without considering that small scale investors provide rental stock at a pace far greater than government can. And while the push has been to build more purpose-built rental buildings it has come at the cost of multi-family units for ownership. This will have long-term effects for buyers and future private rentals in the years to come. Supply and demand shouldn’t be ignored but unfortunately supply is being stifled for future buyers with current policies as well as current economic conditions.
Here’s a summary of the numbers:
Greater Vancouver: Total Units Sold in August were 1,903 – down from 2,333 (18%) in July, down from 2,418 (21%) in June, down from 2,296 (17%) in August 2023, up from 1,892 (1%) in August 2022, down from 3,166 (40%) in August 2021, down from 3,122 (39%) in August 2020, and down from 2,256 (16%) in August 2019; Active Listings were at 13,812 at month end compared to 10,082 at that time last year (up 37%) and 14,326 at the end of July (down 4%); New Listings in August were down 26% compared to July 2024, up 5% compared to August 2023, up 24% compared to August 2022, up 2% compared to August 2021, down 30% compared to August 2020, and up 9% compared to August 2019. Month’s supply of total residential listings is up to 7 month’s supply from 6 (balanced market conditions) and sales to listings ratio of 45% compared to 41% in July 2024, 57% in August 2023, and 56% in August 2022.
Month-over-month, the house price index is down 0.1% and in the last 6 months up 1.2%.
Vancouver Westside: Total Units Sold in August were 337 – down from 416 (19%) in July, down from 470 (28%) in June, down from 433 (22%) in August 2023, down from 380 (11%) in August 2022, down from 593 (38%) in August 2021, down from 490 (31%) in August 2020, and down from 423 (20%) in August 2019; Active Listings were at 2,873 at month end compared to 2,294 at that time last year (up 25%) and 3,040 at the end of July (down 5%); New Listings in August were down 33% compared to July 2024, down 7% compared to August 2023, up 5% compared to August 2022, down 16% compared to August 2021, down 36% compared to August 2020, and up 20% compared to August 2019. Month’s supply of total residential listings is up to 9 month’s supply from 7 (buyer’s market conditions) and sales to listings ratio of 44% compared to 37% in July 2024, 53% in August 2023, and 52% in August 2022.
Month-over-month, the house price index is down 0.3% and in the last 6 months up 1.9%.
Vancouver East Side: Total Units Sold in August were 193 – down from 263 (27%) in July, down from 270 (29%) in June, down from 250 (23%) in August 2023, down from 196 (2%) in August 2022, down from 295 (35%) in August 2021, down from 330 (42%) in August 2020, and down from 235 (18%) in August 2019; Active Listings were at 1,407 at month end compared to 1,013 at that time last year (up 39%) and 1,468 at the end of July (down 4%); New Listings in August were down 23% compared to July 2024, up 20% compared to August 2023, up 38% compared to August 2022, up 7% compared to August 2021, down 38% compared to August 2020, and up 27% compared to August 2019. Month’s supply of total residential listings is up to 7 month’s supply from 6 (balanced market conditions) and sales to listings ratio of 42% compared to 44% in July 2024, 66% in August 2023, and 59% in August 2022.
Month-over-month, the house price index is up 0.3% and in the last 6 months up 1.9%.
North Vancouver: Total Units Sold in August were 145 – down from 201 (28%) in July, down from 221 (34%) in June, down from 160 (9%) in August 2023, up from 126 (15%) in August 2022, down from 212 (32%) in August 2021, down from 239 (39%) in August 2020, and down from 184 (21%) in August 2019; Active Listings were at 675 at month end compared to 498 at that time last year (up 36%) and 740 at the end of July (down 9%); New Listings in August were down 37% compared to July 2024, up 5% compared to August 2023, up 19% compared to August 2022, up 9% compared to August 2021, down 45% compared to August 2020, and up 2% compared to August 2019. Month’s supply of total residential listings is up to 5 month’s supply from 4 (balanced market conditions) and sales to listings ratio of 54% compared to 47% in July 2024, 63% in August 2023, and 56% in August 2022.
Month-over-month, the house price index is down 1.3% and in the last 6 months up 0.6%.
West Vancouver: Total Units Sold in August were 57 – down from 59 (3%) in July, down from 75 (24%) in June, the same as 57 in August 2023, up from 53 (8%) in August 2022, down from 67 (15%) in August 2021, down from 67 (15%) in August 2020, and up from 49 (16%) in August 2019; Active Listings were at 678 at month end compared to 582 at that time last year (up 16%) and 733 at the end of July (down 8%); New Listings in August were down 37% compared to July 2024, down 8% compared to August 2023, down 11% compared to August 2022, up 5% compared to August 2021, down 30% compared to August 2020, and the same as August 2019. Month’s supply of total residential listings is steady at 12 month’s supply (buyer’s market conditions) and sales to listings ratio of 42% compared to 27% in July 2024, 39% in August 2023, and 35% in August 2022.
Month-over-month, the house price index is up 0.8% but in the last 6 months up 4.3%.
Richmond: Total Units Sold in August were 191 – down from 255 (25%) in July, down from 263 (27%) in June, down from 319 (40%) in August 2023, down from 226 (15%) in August 2022, down from 440 (57%) in August 2021, down from 340 (44%) in August 2020, and down from 250 (24%) in August 2019; Active Listings were at 1,632 at month end compared to 1,162 at that time last year (up 40%) and 1,563 at the end of July (up 4%); New Listings in August were down 15% compared to July 2024, up 9% compared to August 2023, up 44% compared to August 2022, up 1% compared to August 2021, down 19% compared to August 2020, and up 5% compared to August 2019. Month’s supply of total residential listings is up to 9 month’s supply from 6 (buyer’s market conditions) and sales to listings ratio of 35% compared to 40% in July 2024, 64% in August 2023, and 60% in August 2022.
Month-over-month, the house price index is up 0.7% and in the last 6 months down 0.3%.
Burnaby East: Total Units Sold in August were 25 – down from 33 (24%) in July, up from 17 (47%) in June, down from 31 (19%) in August 2023, up from 20 (25%) in August 2022, down from 29 (14%) in August 2021, down from 37 (32%) in August 2020, and down from 31 (19%) in August 2019; Active Listings were at 140 at month end compared to 83 at that time last year (up 69%) and 160 at the end of July (down 12%); New Listings in August were down 23% compared to July 2024, up 29% compared to August 2023, up 81% compared to August 2022, down 4% compared to August 2021, down 23% compared to August 2020, and down 8% compared to August 2019. Month’s supply of total residential listings is up to 6 month’s supply from 5 (balanced market conditions) and sales to listings ratio of 51% compared to 52% in July 2024, 82% in August 2023, and 74% in August 2022.
Month-over-month, the house price index is down 0.1% and in the last 6 months up 0.1%.
Burnaby North: Total Units Sold in August were 145 – up from 137 (6%) in July, down from 172 (16%) in June, up from 139 (4%) in August 2023, up from 120 (21%) in August 2022, down from 181 (20%) in August 2021, down from 197 (26%) in August 2020, and up from 129 (12%) in August 2019; Active Listings were at 826 at month end compared to 495 at that time last year (up 67%) and 837 at the end of July (down 1%); New Listings in August were down 26% compared to July 2024, up 13% compared to August 2023, up 54% compared to August 2022, up 23% compared to August 2021, down 16% compared to August 2020, and up 38% compared to August 2019. Month’s supply of total residential listings is steady at 6 month’s supply (balanced market conditions) and sales to listings ratio of 49% compared to 35% in July 2024, 54% in August 2023, and 63% in August 2022.
Month-over-month, the house price index is down 0.6% and in the last 6 months up 0.7%.
Burnaby South: Total Units Sold in August were 112 – down from 140 (20%) in July, down from 135 (17%) in June, down from 133 (16%) in August 2023, down from 123 (9%) in August 2022, down from 199 (44%) in August 2021, down from 130 (14%) in August 2020, and down from 126 (19%) in August 2019; Active Listings were at 634 at month end compared to 445 at that time last year (up 42%) and 682 at the end of July (down 7%); New Listings in August were down 21% compared to July 2024, up 4% compared to August 2023, up 31% compared to August 2022, down 21% compared to August 2021, down 29% compared to August 2020, and down 19% compared to August 2019. Month’s supply of total residential listings is up to 6 month’s supply from 5 (balanced market conditions) and sales to listings ratio of 51% compared to 50% in July 2024, 62% in August 2023, and 73% in August 2022.
Month-over-month, the house price index is down 0.1% and in the last 6 months up 0%.
New Westminster: Total Units Sold in August were 79 – down from 98 (19%) in July, down from 108 (27%) in June, down from 87 (9%) in August 2023, up from 77 (3%) in August 2022, down from 146 (46%) in August 2021, down from 161 (51%) in August 2020, and down from 97 (19%) in August 2019; Active Listings were at 406 at month end compared to 299 at that time last year (up 36%) and 428 at the end of July (down 5%); New Listings in August were down 32% compared to July 2024, down 8% compared to August 2023, up 19% compared to August 2022, down 14% compared to August 2021, down 50% compared to August 2020, and down 14% compared to August 2019. Month’s supply of total residential listings is up to 5 month’s supply from 4 (balanced market conditions) and sales to listings ratio of 56% compared to 47% in July 2024, 56% in August 2023, and 65% in August 2022.
Month-over-month, the house price index is up 1.3% and in the last 6 months up 0.4%.
Coquitlam: Total Units Sold in August were 171 – down from 178 (4%) in July, down from 189 (10%) in June, down from 203 (16%) in August 2023, up from 157 (9%) in August 2022, down from 284 (40%) in August 2021, down from 246 (30%) in August 2020, and down from 198 (14%) in August 2019; Active Listings were at 1,052 at month end compared to 599 at that time last year (up 76%) and 1,057 at the end of July (up 0.5%); New Listings in August were down 16% compared to July 2024, up 43% compared to August 2023, up 60% compared to August 2022, up 38% compared to August 2021, up 3% compared to August 2020, and up 20% compared to August 2019. Month’s supply of total residential listings is steady at 6 month’s supply (balanced market conditions) and sales to listings ratio of 41% compared to 35% in July 2024, 69% in August 2023, and 59% in August 2022.
Month-over-month, the house price index is down 0.6% and in the last 6 months down 0.7%.
Port Moody: Total Units Sold in August were 39 – down from 58 (33%) in July, down from 56 (30%) in June, down from 58 (33%) in August 2023, up from 33 (18%) in August 2022, down from 57 (32%) in August 2021, down from 86 (55%) in August 2020, and the same amount in August 2019; Active Listings were at 243 at month end compared to 167 at that time last year (up 46%) and 238 at the end of July (up 2%); New Listings in August were down 20% compared to July 2024, up 17% compared to August 2023, up 17% compared to August 2022, up 15% compared to August 2021, down 24% compared to August 2020, and up 18% compared to August 2019. Month’s supply of total residential listings is up to 6 month’s supply from 4 (balanced market conditions) and sales to listings ratio of 43% compared to 52% in July 2024, 75% in August 2023, and 43% in August 2022.
Month-over-month, the house price index is down 0.2% and in the last 6 months up 3.6%.
Port Coquitlam: Total Units Sold in August were 56 – down from 66 (15%) in July, down from 62 (10%) in June, down from 69 (19%) in August 2023, up from 78 (28%) in August 2022, down from 97 (43%) in August 2021, down from 169 (67%) in August 2020, and down from 79 (29%) in August 2019; Active Listings were at 306 at month end compared to 169 at that time last year (up 81%) and 331 at the end of July (down 8%); New Listings in August were down 38% compared to July 2024, down 11% compared to August 2023, down 1% compared to August 2022, down 12% compared to August 2021, down 40% compared to August 2020, and down 12% compared to August 2019. Month’s supply of total residential listings is steady at 5 month’s supply (balanced market conditions) and sales to listings ratio of 55% compared to 40% in July 2024, 60% in August 2023, and 76% in August 2022.
Month-over-month, the house price index is down 0.1% and in the last 6 months up 1.4%.
Pitt Meadows: Total Units Sold in August were 21 – down from 27 (23%) in July, down from 28 (25%) in June, down from 23 (9%) in August 2023, up from 17 (24%) in August 2022, down from 24 (12%) in August 2021, down from 42 (50%) in August 2020, and down from 39 (46%) in August 2019; Active Listings were at 105 at month end compared to 78 at that time last year (up 34%) and 108 at the end of July (down 3%); New Listings in August were down 44% compared to July 2024, up 5% compared to August 2023, down 7% compared to August 2022, up 8% compared to August 2021, down 18% compared to August 2020, and up 5% compared to August 2019. Month’s supply of total residential listings is up to 5 month’s supply from 4 (balanced market conditions) and sales to listings ratio of 52% compared to 38% in July 2024, 60% in August 2023, and 39% in August 2022.
Month-over-month, the house price index is down 0.4% and in the last 6 months up 0.1%.
Maple Ridge: Total Units Sold in August were 123 – down from 166 (26%) in July, down from 130 (5%) in June, up from 119 (3%) in August 2023, up from 113 (9%) in August 2022, down from 185 (34%) in August 2021, down from 216 (43%) in August 2020, and down from 133 (8%) in August 2019; Active Listings were at 855 at month end compared to 653 at that time last year (up 30%) and 879 at the end of July (down 3%); New Listings in August were down 19% compared to July 2024, up 1% compared to August 2023, up 18% compared to August 2022, up 26% compared to August 2021, down 9% compared to August 2020, and up 32% compared to August 2019. Month’s supply of total residential listings is up to 7 month’s supply from 5 (balanced market conditions) and sales to listings ratio of 44% compared to 48% in July 2024, 43% in August 2023, and 48% in August 2022.
Month-over-month, the house price index is down 0.6% and in the last 6 months up 0.5%.
Ladner: Total Units Sold in August were 25 – down from 31 (19%) in July, down from 27 (11%) in June, up from 24 (4%) in August 2023, down from 27 (7%) in August 2022, down from 35 (29%) in August 2021, down from 40 (37%) in August 2020, and down from 33 (24%) in August 2019; Active Listings were at 124 at month end compared to 97 at that time last year (up 28%) and 138 at the end of July (down 10%); New Listings in August were down 15% compared to July 2024, up 36% compared to August 2023, up 36% compared to August 2022, up 29% compared to August 2021, down 35% compared to August 2020, and down 33% compared to August 2019. Month’s supply of total residential listings is up to 5 month’s supply from 4 (balanced market conditions) and sales to listings ratio of 56% compared to 58% in July 2024, 73% in August 2023, and 82% in August 2022.
Month-over-month, the house price index is up 1.0% and in the last 6 months up 3.8%.
Tsawwassen: Total Units Sold in August were 32 – down from 45 (29%) in July, down from 44 (27%) in June, up from 28 (14%) in August 2023, up from 25 (28%) in August 2022, down from 74 (57%) in August 2021, down from 53 (40%) in August 2020, and up from 30 (7%) in August 2019; Active Listings were at 199 at month end compared to 162 at that time last year (up 23%) and 206 at the end of July (down 3%); New Listings in August were down 15% compared to July 2024, up 11% compared to August 2023, down5% compared to August 2022, down 9% compared to August 2021, down 46% compared to August 2020, and down 18% compared to August 2019. Month’s supply of total residential listings is up to 6 month’s supply from 5 (balanced market conditions) and sales to listings ratio of 53% compared to 63% in July 2024, 52% in August 2023, and 40% in August 2022.
Month-over-month, the house price index is up 0.6% and in the last 6 months up 4.1%.
Fraser Valley: Sales in August were down 13.1%, compared to July and were down 16.2% from August 2023. New listings were down 18.6% from July and up 5.9% from August 2023.The average price was up 3.4% month-over-month and is up 7.9% year-over-year. Active listings were down 1.2% to 8,626 from 8,731 last month and up 37.1% from August 2023 which was at 6,291. Month’s supply of total residential listings is up to 8 month’s supply from 6 (buyer’s market conditions).
“Despite two policy rate cuts by the Bank of Canada, buyers are still feeling the squeeze of overall affordability challenges in B.C,” said Jeff Chadha, Chair of the Fraser Valley Real Estate Board. “With prices for single-family homes, townhouses and condos holding relatively flat year-over-year, many continue to face challenges buying their first home or moving up in the market, as reflected in seasonally slow August sales.”
Month-over-month, the house price index is down 0.6% and in the last 6 months 0.8%.