Highlights of July Dexter Report
Home prices are virtually unchanged in the past year.
Total sales in Greater Vancouver are up nearly 30% from July 2022
Wily buyers take advantage of a summer sales slump
There are now 16,400 properties for sale across Metro Vancouver
Vancouver density plan invites higher taxes for owners
On July 25 the City of Vancouver recommended a massive rezoning of single-family neighbourhoods to create more of what is known as the “missing middle” housing. The province wants to make such ideological-driven rezoning mandatory in every city in British Columbia with legislation promised to come this fall.
The Vancouver concept would allow four to six homes to be built on most RS-zoned lots, or 60 percent of the city’s buildable land, according to the ‘senior green building planner’ for Vancouver. It also restricts the size of any new detached house. The policy, though, has forgotten the major player in the plan: detached house owners, many of whom want no part of it.
The City of Victoria passed a similar rezoning plan in January of this year. Seven months later not a single application has come forward from a detached house owner willing to turn their private land into a multi-unit rental complex.
Many detached house owners are not willing to risk their financial future and peace of mind by jumping on board a plan that they fear, rightly, will transform their quiet communities and expose them to the federal capital gains tax that could grab up to 50% of their real estate equity for investment properties.
Consider this. The average price of a Vancouver Westside detached house in July was nearly $4.3 million. If sold as a paid-for private residence, the capital gains tax would be zero. But, if the owner divided the house into four rentals and lived in one unit and then sold the property for the same price, the owner would be responsible for capital gains tax as the owner of the income-producing property.
As well, under Vancouver’s missing middle plan, the detached house owner could only produce a “below-market rental unit” or a secure rental unit (which means forever); or pay a “set-rate bonus payment” for the increased density as a market rental. There is no definition of what the bonus payment would be, but currently, in the Cambie area, it averages $135 per square foot for the extra space in a new development.
The house owner would also be subject to the GST on any new construction; would be required to build any new homes under Vancouver’s expensive and confusing “passive house” energy regulations; and would be subject to higher property taxes and utility costs yet would only be allowed to increase rents by 2% per year under provincial regulations. Private detached house owners are somehow, miraculously, expected to deliver what seasoned developers, city planners and other bureaucrats cannot: low-cost rentals in Vancouver.
The City of Vancouver will present its missing middle plan to public hearings in September. Expect a lot of discussion.
Prices are not skyrocketing.
There is a lot of media noise being tossed around about “skyrocketing” Greater Vancouver home prices. While true the Benchmark Price is up about 10% from January to July 2023, to $1,210,700, prices are just 0.5% higher compared to a year ago and in a dozen Greater Vancouver communities – including Burnaby North, Coquitlam, Tsawwassen and West Vancouver – composite prices are lower now than in July 2022. On the bellwether Westside of Vancouver, the July benchmark detached house price, at $3,458,000, was up just 1% from a year ago.
The benchmark condo price this July is $771,600, up 2.7% from last year, but condo prices in East Vancouver, Burnaby North and Burnaby East, arguably the most active condo markets in Greater Vancouver, are up less than 1% from July of last year, which should help convince more buyers to take advantage of the summer slowdown to get into the Greater Vancouver market now.
After peaking in May, sales have declined month by month since buyers have now faced two straight increases in the Bank of Canada rate. Greater Vancouver's total sales in July, at 2,455, were down from 2,988 in June to the lowest level since March. In the Fraser Valley, July sales fell nearly 30% from June 2023 and benchmark prices are up an average of 1% from a year ago. But even with the decline in sales transactions, buyers still want to buy, and many sellers are not desperate to sell.
As the summer continues, there will be more opportunities than we’ve seen over the last four months for buyers. With many people away or taking a break from the market, it’s the prime time to be a buyer. Inventories have increased, giving more options, especially in some areas.
The increase in the Bank of Canada rate and fixed rates bumping up over the last month or so have pulled some buyers from the market. Those with 60 to 90-day rate holds are trying to buy before those rate holds expire while others are content to wait out the increases in borrowing costs. With travel and the many local events returning occupying many people’s time, real estate is losing some of the attention it normally would get. Of course, the lack of resale inventory continues to challenge the market and while we wouldn’t expect to see it increase during the summer months, the number of new listings dropped while absorption rates remained close to the levels we’ve seen this year, and in some areas increased. July saw 4,757 new listings after June produced 5,466 new listings after there were 5,776 new listings in May. Year over year, new listings were higher with 4,067 new listings produced last July which is helping would-be buyers in the market.
Don’t expect the higher interest rates to result in more listings. Sales of residential land to developers have fallen 80% in the past year, largely due to rising financing costs, which will stunt delivery of new strata homes into next year, at least. As well, the Financial Consumer Agency of Canada and the Federal Government have issued guidelines for Canadian banks to help homeowners facing significant increases in mortgage costs. Measures such as waiving penalties to break mortgages and increasing amortization periods to lower payments are on the table.
Banks do not want to own homes, so don’t expect increased rates to lead to a major rise in mortgage foreclosures or distressed sales.
Instead, serious buyers should be ignoring summer temptations and shopping through the 10,301 active listings now on the market. Buyers can take advantage of a shallow slump and good selection to secure a property now.
Regional numbers for July 2023
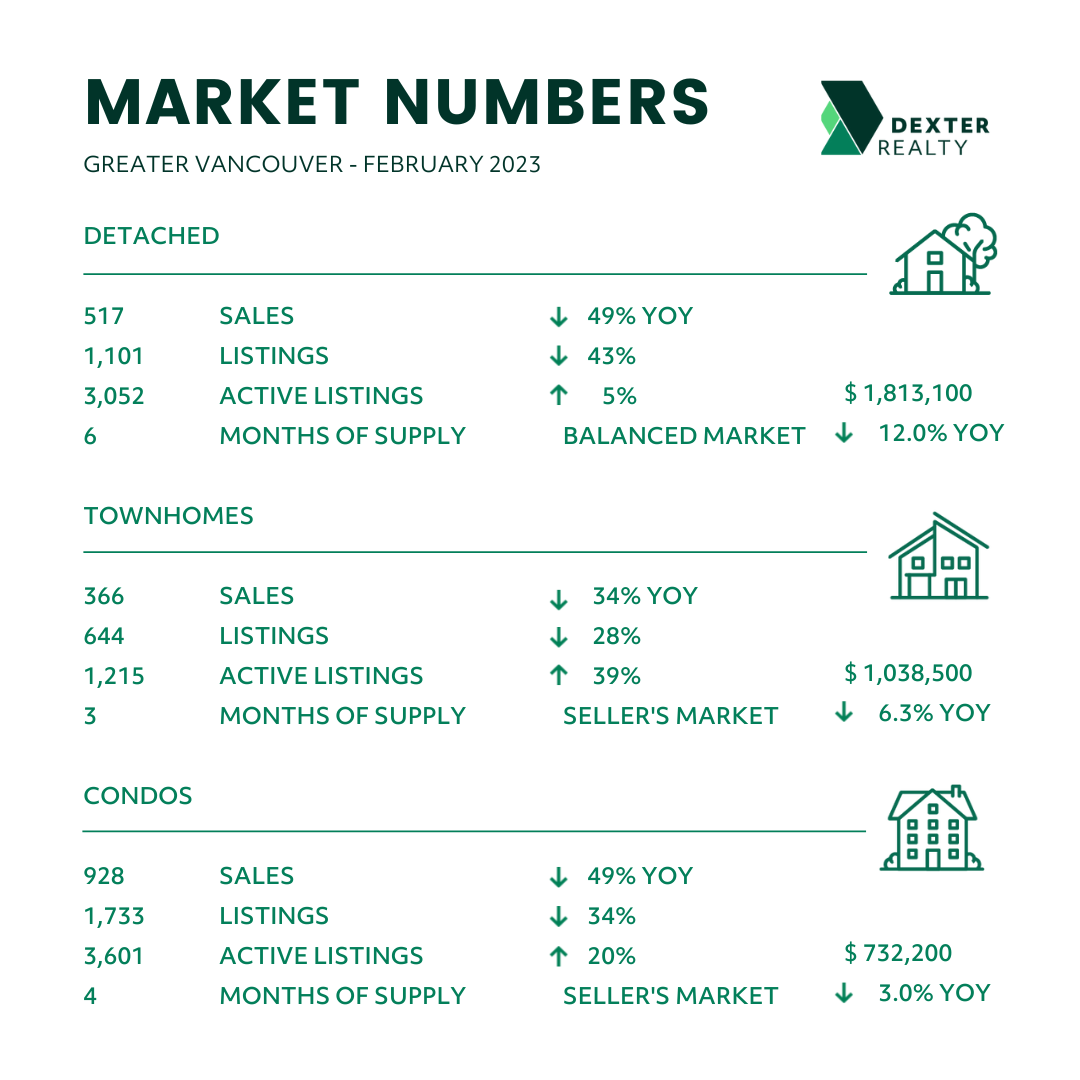
Greater Vancouver: Total transactions reached 2,455 in July 2023, a 28.9% increase from the 1,904 sales recorded in July 2022. This was 15.6% below the 10-year seasonal average and the lowest level in five months. Total inventory at month end, 10,a301 properties, has moved to a 4-month supply, with detached up to 6 months and into balanced market territory. Townhouses and condos are still at a 3-month supply, though price is key for buyers right now. Looking at year-over-year, sales-to-listings ratios are up while condos remained the same. Overall, the 52% absorption in July is showing strength considering the increase in fixed and variable-rate mortgages. The Benchmark Price for all residential properties is currently $1,210,700. This represents a 0.5 per cent increase over July 2022 and a 0.6 per cent increase compared to June 2023.
Fraser Valley: July new listings, at 2,855, were down 16.6% compared to June 2023 but 19.7% higher than July 2022 levels, and virtually on par with the 10-year average. Active listings climbed by 4.3% over June, bringing the total inventory for sale to 6,199 properties. Sales totalled 1,368 in July, a decrease of 29.3% from June 2023, but still 37.8% above July 2022. Benchmark detached and townhouse prices were down about 2% from a year ago, with detached at $1,543,300, townhouses at $850,300 , while condo apartment prices increased 0.8% year-to-year at $555,500.
Vancouver Westside: Total sales in July, at 438, were down 17% from a month earlier and 19% higher than July 2022. Despite a 10% surge in benchmark detached house prices since January, prices are up just 1% from a year ago at $3,458,000. Competition is fierce for anything under $3 million. In Kitsilano earlier this week there were only 8 detached homes listed below $3 million, and just 4 in Point Grey, with multiple offers being seen. Active listings were 2,366 at month end compared to 2,453 at that time last year and 2,249 at the end of June. New listings in July were down 7% compared to June 2023. Condo apartments dominated July sales with 325 transactions, and benchmarked at $866,300, up 4% from a year ago. The supply of total residential listings is up to 5-month supply and sales to listings ratio is 43% in this balanced market.
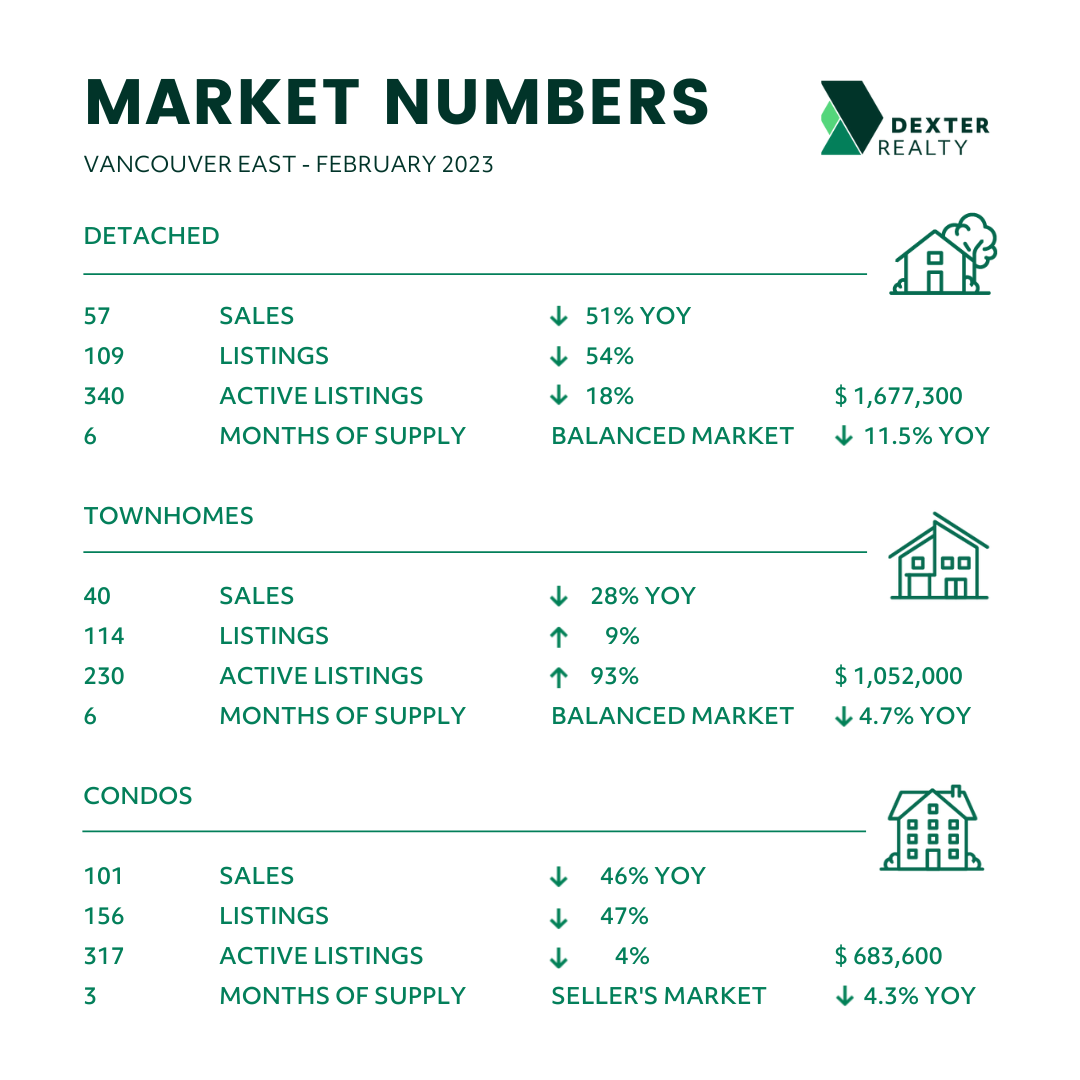
Vancouver East Side: The East Side story in July included a 12% dip in sales from a month earlier and a 21% decline from May 2023, with 286 transactions. Detached house prices flatlined from June 2023, at $1,897,200, but are up 3.7% from a year ago. Condo prices are just 0.5% higher than in July 2022, at $717,700. Active Listings were at 1,082 at month end compared to 1,191 at that time last year and 1,082 at the end of June. New listings in July were down 18% compared to June 2023. This is a seller’s market with just a 4-month supply and sales-to-listing ratio of 57%.
North Vancouver: North Van remains a strong seller’s market, especially in the condo sector, which has only a 2-month supply of inventory and a 68% sales-to-listing ratio. The benchmark condo price is $814,400, which has not moved much (up 2%) in a year, despite the robust sales. A total of 185 properties sold in July and sales have tracking down since May. Active listings were at 530 at month end compared to 573 at that time last year and 553 at the end of June; New Listings in July were down 21% compared to June 2023.
West Vancouver: Total sales were 47 in July as the summer siesta affected even the most prestigious market in Metro. This is a buyer’s market with more than 600 active listings and sales ratio in the mid-20% range and a 13-month supply of properties for sale. The Benchmark Price is a north of $2.6 million and the typical detached house sold in July for $3,241,000, down 4.2% from a year earlier.
Richmond: Richmond should be benefitting from Canada’s immigration surge but there is a disconnect in Ottawa: there is a foreign homebuyer ban for two year and no one in charge apparently realized that 500,000 newcomers may need a place to live. There is little relief in sight: when the federal cabinet was shuffled the former immigration minister became the new housing minister. Richmond, the most multi-ethnic enclave in B.C., has seen housing sales drop 26% over the past two months to 294 in July and new listings were down 15% from a month earlier. This remains a seller’s market, though, with just a 3-month supply, a sales ratio of 53% and the Benchmark Price up 2.6% year-over-year to $1,118,300.
Burnaby East: Sales in July, at 47, were lower than even three years ago and new listings dropped sharply 39% from June 2023. Still, with a sales-to-listing ratio of 64% from a limited supply, this qualifies as a seller’s market. Condos are the market maker here, as in most of Burnaby, but the benchmark condo price is frozen, rising just 0.7% over the last 12 months to $803,700 in July.
Burnaby North: Total sales in July were 160, down from 170 in June 2023, but, up from 29% compared to July 2022. Active Listings were at 481 at month-end compared to 475 at that time last year and 440 at the end of June. A seller’s market with a 3-month supply and a sales ratio of 55%, detached houses are the only sector posting year-over-year price gains, with detached prices up 2.4% to just over $2 million. Townhouse prices, by comparison, are down 2.7% year-over-year and condo benchmarks have flatlined at $747,000. The sales ratio is 55% but this more a reflection of supply than demand.
Burnaby South: Total sales wilted 40% over the past two months and July was far from hot with transactions at 139, lower even than in July of 2019 but up 10% from July 2022. The Benchmark Price inched up 1.1% from June 2023 to $1,135,000. There is a tight supply of 457 properties for sale and the sales ratio is running at 59%, the lowest July pace in three years.
New Westminster: The secret is out as buyers have found that the Royal City is one of the best-priced markets in Metro Vancouver. Detached sales, at 119, are up from June 2023 and up 127% year-over-year with a 97% absorption rate. The condo market saw a growth in new listing in July compared to June but, like townhomes, remain in a seller’s market with 2-month supply. The Benchmark Price in New Westminster is $846,400, up 2% from a year ago.
Coquitlam: Sales in July, at 223, were down 16% from a month earlier and 21% from May, but up 57% year-over-year in this seller’s market. The big mover is townhouses, with sales up 157% year-over-year and active listings down from June. The townhouse benchmark is $1,061,900, down nearly 2% from a year ago and it dropped a further 1% in July compared to a month earlier. Detached house prices are holding firm at $1,795,400, as is the overall sales-to-listing ratio of 55%,
Port Moody: Two big residential developments have apparently been approved, including the three-tower Westport Village on the former Andres Wine site, which has been in 18 years in planning. It will supply hundreds of new housing units, eventually, to a market with just a 2-month supply of listings. With total sales of 85 in July, down from one and two months earlier, and a sales ratio of 77%, this is a strong seller’s market. The Benchmark Price is down 6.5% from a year ago at $1,121,500.
Port Coquitlam: Buyers scrambling for more affordability can’t find enough supply in the lowest-priced TriCities market where the Benchmark Price in July was $975,800. Condos are down to a one-month supply. The lack of inventory, just 172 total active listings, has stunted sales, which dropped to 73 in July, the lowest level for that month in at least four years, despite a sales-to-listing-ration of 60%.
Pitt Meadows: The sales-to-listing ratio was 52% in this seller’s market where buyers are chasing too-few listings. With new listings falling, there were only 74 properties on the market at the end of July after 24 sales in the month. Despite a price rally this year, the benchmark detached house price is just 2.4% higher than a year earlier, at $1,355,900. Townhouse prices are down 1.8%, year-over-year, to $836,6000.
Maple Ridge: Total sales have been tracking down since May, but reached 143 transactions in July, up 32% from July 2022. At $739,600, Maple Ridge has the lowest priced townhouses in Metro Vancouver. The benchmark detached house is down 2.4% from a year ago, at $1,307,400. With 622 active listings and a sales success ratio of 50%, this is a seller’s market with stable pricing.
Ladner: There were 22 fresh townhome listings in July compared to just 7 in June 2023, as the benchmark price increased 4.1% from a year earlier to $987,500.
Detached sales suffered from higher lending rates, though as sales dropped to 14 from 23 transactions in June 2023 even as the benchmark price jumped 16% so far this year to $1,50,2000. Prices are still slightly below a year earlier. There are 102 total active listings and a sales ratio of 45% in this seller’s market.
Tsawwassen: Buyers aren’t the problem in Tsawwassen, with an overall sales ratio of 58% and condominium absorption up to 69% from 63% in June. The problem is supply with new listings dropping 9% from June 2023, and just 161 active listings available. The Benchmark Price is down about 2% across the board compared to a year earlier, to $1,222,000, with detached houses at $1,550,600, despite price increase since February. This is considered a balanced market.
Surrey: Detached house sales fell 34% in July from a year earlier but were up 30% from June in a perplexing rally considering recent interest rate hikes. Detached prices, however, have barely moved, up 1.1% from July 2022 to $1,683,300. Townhouse and condo sales are down double-digits from a year ago, at, respectively, $893,000 and $555,000 in July. The Fraser Valley Real Estate chairman summed up the Valley market well: “Summer is typically a slower period for the real estate sector and the higher interest rates are contributing to the market slowdown,” said Narinder Bains “We’re seeing less traffic as buyers and sellers put a pause on decisions and we expect this trend to continue until the fall cycle.”
Download June Sales and Listings Statistics All Regional
Download June Sales and Listings Statistics Houses Townhouses Condos
Download Sales & Listings Images
Kevin Skipworth, Partner/Broker and Chief Economist at Dexter Realty