Highlights of Dexter’s March 2026 report
Significant gains in sales since January
Inventory rising, but improving absorption keeps market balanced
Balanced conditions expanding across most Metro Vancouver submarkets
Suburbs showing more confidence
March Market Overview: Momentum Returns, Balance Builds, and Opportunity Expands
As we moved into spring, the real estate market in March showed acceleration with discipline. Across Greater Vancouver, the story is no longer about volatility or extremes. It’s about structure. It’s about a market that is finding its footing after several years of disruption and is now transitioning into a more sustainable, opportunity-rich environment for both buyers and sellers. The data from March reinforces a trend that has been building since the start of the year, momentum is returning, and it’s doing so on a healthier, more balanced foundation.
Sales activity climbed meaningfully month-over-month, rising to 2,032 transactions, a 23% increase from February and an 84% surge from January. That kind of sequential growth matters. It signals re-engagement. It reflects buyers stepping back into the market with greater confidence and intent. While sales remain modestly below the elevated levels seen in recent years, down slightly compared to March 2025 and more notably relative to 2023 and 2024, the trajectory is what stands out. The market is not chasing peaks; it is rebuilding momentum in a more measured and sustainable way.
At the same time, inventory continues to expand, but not in a way that signals weakness. Active listings reached 14,774 at month-end, up 9% from February and slightly higher than this time last year. The number of new listings followed suit, increasing to 5,920 in March, up 23% from February. Sellers are stepping forward but not flooding the market. The increase in supply is not a negative but a necessary ingredient for a functioning market. More property listings mean more choice, more transactions, and ultimately more stability. But there is a noticeable increase in competition for those listings, buyers need to be ready.
The result is a market that is firmly in balanced territory. Months of supply tightened from 8 to 7, while the sales-to-listings ratio held steady at 34%. These are healthy numbers. They indicate that while buyers have options, demand is keeping pace. This is not a stalled market but rather it’s a working one.
The most important shift underway isn’t just numerical, it’s behavioral. Buyers are moving from the sidelines and less sellers are testing unrealistic price points. Instead, both sides are engaging with a clearer understanding of value. That alignment is what’s driving stability.
A Market Finding Its Rhythm
Across the region, we’re seeing fewer extremes and more consistency. Sales are rising steadily rather than spiking. Inventory is available without overwhelming demand. Balanced conditions are no longer isolated; they’re becoming the norm.
March is typically the month where the spring market either accelerates or stalls. This year, it’s clearly accelerating, but in a measured, sustainable way.
Greater Vancouver sales in March were 32% below the 10-year average after February was 29% below the 10-year average and January was 31% below the 10-year average. March struggled against the long-term averages but given the global uncertainty occurring, it’s not surprising. Given the trajectory from January though, this could be an indication that buyers are tired of waiting and with prices having moved off the highs from 4 years ago, opportunity continues to be the greatest we’ve seen in some time.
The number of new listings in March were 5% above the 10-year average after February was 7% above the 10-year average, and January 19% above the 10-year. The abundance of listings is slowing in Metro Vancouver which is even more reason for buyers to take advantage now instead of waiting.
City of Vancouver: Balanced and Active
Vancouver Westside
The Westside continues to show steady improvement. Sales rose 23% month-over-month to 367 transactions, while months of supply dropped to 7. Notably, inventory remains lower than last year despite a monthly increase, an indication that supply is being absorbed more efficiently. The sales-to-listings ratio held at 34%, reinforcing stable, balanced conditions.
This is a market that isn’t overheating, but it’s no longer hesitant either. Demand at higher price points is returning with discipline, not urgency.
Vancouver East Side
The East Side remains one of the most stable and reliable segments in the region. Sales increased modestly month-over-month, while maintaining a strong rebound from January levels.
Months of supply edged up slightly to 7 months, but this reflects increased inventory rather than weakening demand. The market remains firmly balanced, with consistent absorption across product types.
Affordability relative to the Westside continues to anchor demand here, particularly for ground-oriented housing.
North Shore: Quiet Strength
North Vancouver
North Vancouver is now one of the more competitive while balanced markets in the region. Sales rose 37% month-over-month, and months of supply tightened further to 5, approaching seller-leaning conditions. Inventory has increased, but demand is keeping pace. This is a clear example of healthy growth: more listings, more sales, and tightening supply all at once.
West Vancouver
West Vancouver continues its gradual recovery. Sales increased 39% month-over-month, and months of supply dropped significantly from 18 to 14 months. While still firmly in buyer’s market territory, the trend is improving. Luxury markets move later in the cycle, and what we’re seeing now is early-stage stabilization.
Richmond
Richmond posted a strong 46% increase in sales month-over-month, alongside rising new listings. Months of supply improved from 12 to 9 months, marking steady progress toward balance. This market continues to normalize after a period of elevated activity prior to interest rate hikes. Increased inventory is being met with gradually improving demand, which is exactly what a sustainable transition requires.
Burnaby
Burnaby continues to demonstrate consistency across all segments:
Burnaby East improved modestly, with declining supply and increasing activity.
Burnaby North saw sales increase and months of supply tighten to 7 months, firmly balanced.
Burnaby South held steady with 8 months, with stable absorption despite rising inventory.
The common thread is stability. This is a market benefiting from its central location, transit access, and steady end-user demand. Burnaby could be one of the best markets for opportunity in the region.
New Westminster and the Tri-Cities: Leading the Shift
New Westminster
New Westminster held steady in March, maintaining balanced conditions with 7 months of supply and a consistent 33% sales-to-listings ratio.
Flat sales month-over-month may seem unremarkable, but in a transitioning market, stability is a strength, not a weakness.
Coquitlam
Coquitlam continues to show strong underlying demand. Sales increased 17% from February but a whopping 113% from January, and months of supply tightened to 6 months.
This market is now firmly balanced and edging toward competitive conditions, supported by continued population growth and transit-driven development.
Port Moody
Port Moody saw one of the stronger month-over-month gains, with sales up 61% and months of supply dropping to 6 months.
Lifestyle-driven demand remains a key factor here, and improving absorption suggests buyers are stepping in with confidence.
Port Coquitlam
Port Coquitlam remains balanced, though absorption softened slightly compared to February. Still, months of supply remained at 7 months, well within stable territory.
Pitt Meadows
Pitt Meadows stands out this month. Sales surged 138% from February, and months of supply dropped sharply from 10 to 5 months. That is a significant shift in a short period of time and signals strong re-engagement from buyers.
Maple Ridge
Maple Ridge continues to build momentum. Sales rose 20% month over month, and months of supply dropped to 6. Affordability and space continue to drive demand, and the market is now firmly balanced.
Ladner
Ladner is now one of the tightest balanced markets in the region. Months of supply dropped to 5 months, while the sales-to-listings ratio climbed to 46%. This follows a dramatic recovery over the past two months and reflects how quickly smaller markets can shift once demand returns.
Tsawwassen
Tsawwassen remains more supply-heavy, holding at 10 months of inventory, but absorption improved. Sales increased month over month, and the sales-to-listings ratio rose to 34%. The trend is positive, even if the market is taking longer to rebalance.
Fraser Valley Tells a Similar Story as Greater Vancouver
Much like Greater Vancouver, the Fraser Valley market saw inventory tightening with months of supply continuing to decline after being at 12 months supply in January. March finished with 9 months of supply and was slightly under total active listings at the end of March last year. Sales patterns were like Greater Vancouver with a healthy 20% jump in sales from February while only down marginally from March of last year. There were 1,007 sales in March compared to 843 in February and 1,036 in March 2025. Townhomes continue to be the best performing segment of the market with the tightest supply while detached homes continue to be abundant, steadfast in a buyer’s market. But those numbers are coming down with the likes of North Surrey going from 15 months supply in February to 11 months in March, and South Surrey going from 17 months to 12.
Overall, months of supply in the Fraser Valley decreased from 10 months in February to 9 months in March which was the same as 9 months in March 2025. Improvement in the Fraser Valley is happening.
What Comes Next
The foundation is now in place for a steady spring market. Momentum has carried through January, accelerated in February, and held firm in March. That continuity matters. It suggests that activity is not driven by short-term factors, but by a broader normalization of market conditions and significant pent-up demand.
Key trends to watch:
Continued alignment between supply and demand
Gradual tightening in balanced markets
Increased activity in higher price segments as confidence builds
Stable pricing supported by consistent absorption
The market isn’t chasing growth, it’s building it.
Here’s a summary of the numbers:
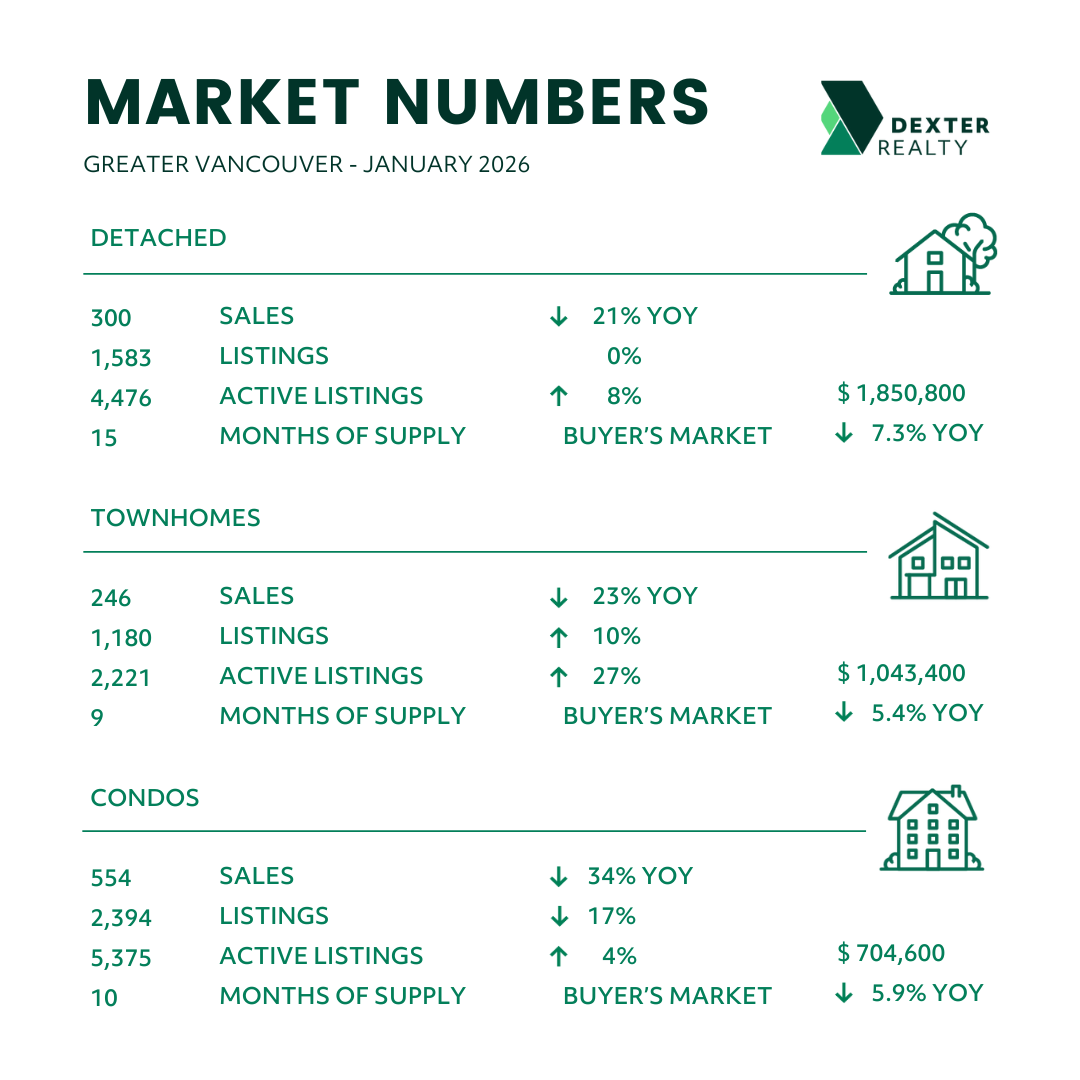
Greater Vancouver: Total Units Sold in March were 2,032, up from 1,648 (23%) in February, up from 1,107 (84%) in January, down from 2,091 (3%) in March 2025, down from 2,415 (16%) in March 2024, and down from 2,535 (20%) in March 2023; Active Listings were at 14,774 at month end compared to 14,546 at that time last year (up 2%) and 13,545 at the end of February (up 9%); the 5,920 New Listings in March were up 23% compared to February, up 13% compared to January, down 10% compared to March 2025, up 16% compared to March 2024 and up 34% compared to March 2023. Month’s supply of total residential listings is down to 7 months from 8 (balanced market conditions) and sales to listings ratio of 34% compared to 34% in February, 21% in January, 32% in March 2025, 47% in March 2024 and 57% in March 2023.
Vancouver Westside: Total Units Sold in March were 367 up from 298 (23%) in February, up from 190 (93%) in January, down from 394 (7%) in March 2025, down from 424 (13%) in March 2024, and down from 449 (18%) in March 2023; Active Listings were at 2,676 at month end compared to 3,093 at that time last year (down 13%) and 2,470 at the end of February (up 8%); the 1,067 New Listings in March were up 23% compared to February, up 16% compared to January, down 19% compared to March 2025, up 10% compared to March 2024 and up 15% compared to March 2023. Month’s supply of total residential listings is down to 7 months from 8 (balanced market conditions) and sales to listings ratio of 34% compared to 34% in February, 21% in January, 30% in March 2025, 44% in March 2024 and 49% in March 2023.
Vancouver East Side: Total Units Sold in March were 231, up from 220 (5%) in February, up from 127 (82%) in January, down from 247 (6%) in March 2025, down from 285 (19%) in March 2024, and down from 287 (20%) in March 2023; Active Listings were at 1,530 at month end compared to 1,494 at that time last year (up 2%) and 1,391 at the end of February (up 10%); the 677 New Listings in March were up 29% compared to February, up 4% compared to January, down 8% compared to March 2025, up 13% compared to March 2024 and up 47% compared to March 2023. Month’s supply of total residential listings is up to 7 months from 6 (balanced market conditions) and sales to listings ratio of 34% compared to 42% in February, 19% in January, 34% in March 2025, 48% in March 2024 and 62% in March 2023.
North Vancouver: Total Units Sold in March were 185, up from 135 (37%) in February, up from 92 (101%) in January, up from 171 (8%) in March 2025, down from 187 (1%) in March 2024, and down from 215 (14%) in March 2023; Active Listings were at 939 at month end compared to 844 at that time last year (up 11%) and 790 at the end of February (up 19%); the 501 New Listings in March were up 25% compared to February, up 23% compared to January, down 2% compared to March 2025, up 51% compared to March 2024 and up 36% compared to March 2023. Month’s supply of total residential listings is down to 5 months from 6 (balanced market conditions) and sales to listings ratio of 37% compared to 34% in February, 23% in January, 33% in March 2025, 56% in March 2024 and 58% in March 2023.
West Vancouver: Total Units Sold in March were 46, up from 33 (39%) in February, up from 29 (59%) in January, up from 40 (15%) in March 2025, down from 53 (13%) in March 2024, and down from 64 (28%) in March 2023; Active Listings were at 636 at month end compared to 626 at that time last year (up 2%) and 581 at the end of February (up 9%); the 214 New Listings in March were up 35% compared to February, the same as January, down 4% compared to March 2025, up 14% compared to March 2024 and up 31% compared to March 2023. Month’s supply of total residential listings is down to 14 months from 18 (buyer’s market conditions) and sales to listings ratio of 21% compared to 21% in February, 14% in January, 19% in March 2025, 28% in March 2024 and 39% in March 2023.
Richmond: Total Units Sold in March were 209, up from 143 (46%) in February, up from 129 (62%) in January, down from 220 (5%) in March 2025, down from 279 (25%) in March 2024, and down from 352 (41%) in March 2023; Active Listings were at 1,891 at month end compared to 1,728 at that time last year (up 9%) and 1,786 at the end of February (up 6%); the 681 New Listings in March were up 32% compared to February, up 14% compared to January, down 7% compared to March 2025, up 23% compared to March 2024 and up 42% compared to March 2023. Month’s supply of total residential listings is down to 9 months from 12 (buyer’s market conditions) and sales to listings ratio of 31% compared to 28% in February, 22% in January, 30% in March 2025, 50% in March 2024 and 74% in March 2023.
Burnaby East: Total Units Sold in March were 24, up from 19 (26%) in February, up from 9 (167%) in January, down from 27 (11%) in March 2025, down from 32 (25%) in March 2024, and up from 20 (20%) in March 2023; Active Listings were at 182 at month end compared to 174 at that time last year (up 5%) and 162 at the end of February (up 12%); the 79 New Listings in March were up 14% compared to February, up 22% compared to January, down 7% compared to March 2025, up 49% compared to March 2024 and up 68% compared to March 2023. Month’s supply of total residential listings is down to 8 months from 9 (buyer’s market conditions) and sales to listings ratio of 30% compared to 28% in February, 14% in January, 32% in March 2025, 60% in March 2024 and 43% in March 2023.
Burnaby North: Total Units Sold in March were 118, up from 97 (22%) in February, up from 80 (48%) in January, up from 107 (10%) in March 2025, up from 109 (8%) in March 2024, and down from 169 (30%) in March 2023; Active Listings were at 830 at month end compared to 878 at that time last year (down 5%) and 772 at the end of February (up 16%); the 353 New Listings in March were up 24% compared to February, up 3% compared to January, down 17% compared to March 2025, up 16% compared to March 2024 and up 48% compared to March 2023. Month’s supply of total residential listings is down to 7 months from 8 (balanced market conditions) and sales to listings ratio of 33% compared to 34% in February, 23% in January, 25% in March 2025, 36% in March 2024 and 71% in March 2023.
Burnaby South: Total Units Sold in March were 95, up from 85 (12%) in February, up from 67 (42%) in January, down from 94 (1%) in March 2025, down from 142 (33%) in March 2024, and down from 130 (27%) in March 2023; Active Listings were at 722 at month end compared to 671 at that time last year (up 8%) and 643 at the end of February (up 12%); the 291 New Listings in March were up 35% compared to February, up 14% compared to January, up 2% compared to March 2025, up 19% compared to March 2024 and up 22% compared to March 2023. Month’s supply of total residential listings is steady at 8 months (buyer’s market conditions) and sales to listings ratio of 33% compared to 40% in February, 26% in January, 33% in March 2025, 58% in March 2024 and 55% in March 2023.
New Westminster: Total Units Sold in March were 76, the same as February, up from 48 (58%) in January, down from 104 (27%) in March 2025, down from 108 (30%) in March 2024, and down from 96 (21%) in March 2023; Active Listings were at 567 at month end compared to 513 at that time last year (up 11%) and 515 at the end of February (up 10%); the 228 New Listings in March were the same as February, up 4% compared to January, down 15% compared to March 2025, up 8% compared to March 2024 and up 62% compared to March 2023. Month’s supply of total residential listings is steady at 7 months (balanced market conditions) and sales to listings ratio of 33% compared to 33% in February, 22% in January, 39% in March 2025, 51% in March 2024 and 68% in March 2023.
Coquitlam: Total Units Sold in March were 190, up from 163 (17%) in February, up from 89 (113%) in January, down from 233 (18%) in March 2025, down from 235 (19%) in March 2024, and down from 196 (3%) in March 2023; Active Listings were at 1,212 at month end compared to 1,173 at that time last year (up 3%) and 1,116 at the end of February (up 9%); the 521 New Listings in March were up 25% compared to February, up 16% compared to January, down 12% compared to March 2025, up 23% compared to March 2024 and up 70% compared to March 2023. Month’s supply of total residential listings is down to 6 months from 7 (balanced market conditions) and sales to listings ratio of 36% compared to 39% in February, 20% in January, 39% in March 2025, 55% in March 2024 and 64% in March 2023.
Port Moody: Total Units Sold in March were 58, up from 36 (61%) in February, up from 25 (132%) in January, down from 51 (14%) in March 2025, down from 45 (29%) in March 2024, and down from 80 (27%) in March 2023; Active Listings were at 343 at month end compared to 279 at that time last year (up 23%) and 308 at the end of February (up 11%); the 172 New Listings in March were up 27% compared to February, up 19% compared to January, down 13% compared to March 2025, up 64% compared to March 2024 and up 51% compared to March 2023. Month’s supply of total residential listings is down to 6 months from 9 (balanced market conditions) and sales to listings ratio of 34% compared to 27% in February, 17% in January, 34% in March 2025, 43% in March 2024 and 70% in March 2023.
Port Coquitlam: Total Units Sold in March were 53, up from 46 (15%) in February, up from 28 (89%) in January, down from 62 (15%) in March 2025, down from 89 (40%) in March 2024, and down from 69 (23%) in March 2023; Active Listings were at 354 at month end compared to 313 at that time last year (up 13%) and 309 at the end of February (up 15%); the 180 New Listings in March were up 80% compared to February, up 7% compared to January, up 2% compared to March 2025, up 29% compared to March 2024 and up 42% compared to March 2023. Month’s supply of total residential listings is steady at 7 months (balanced market conditions) and sales to listings ratio of 29% compared to 46% in February, 17% in January, 35% in March 2025, 64% in March 2024 and 54% in March 2023.
Pitt Meadows: Total Units Sold in March were 31, up from 13 (138%) in February, up from 9 (244%) in January, up from 27 (14%) in March 2025, up from 29 (7%) in March 2024, and up from 28 (11%) in March 2023; Active Listings were at 142 at month end compared to 105 at that time last year (up 35%) and 128 at the end of February (up 11%); the 77 New Listings in March were up 12% compared to February, up 45% compared to January, down 16% compared to March 2025, up 83% compared to March 2024 and up 79% compared to March 2023. Month’s supply of total residential listings is down to 5 months from 10 (balanced market conditions) and sales to listings ratio of 40% compared to 18% in February, 16% in January, 40% in March 2025, 69% in March 2024 and 65% in March 2023.
Maple Ridge: Total Units Sold in March were 126, up from 105 (20%) in February, up from 72 (75%) in January, up from 108 (16%) in March 2025, down from 187 (33%) in March 2024, and down from 149 (15%) in March 2023; Active Listings were at 814 at month end compared to 832 at that time last year (down 2%) and 769 at the end of February (up 6%); the 306 New Listings in March were up 10% compared to February, up 10% compared to January, down 13% compared to March 2025, down 17% compared to March 2024 and up 12% compared to March 2023. Month’s supply of total residential listings is down to 6 months from 7 (balanced market conditions) and sales to listings ratio of 41% compared to 37% in February, 25% in January, 30% in March 2025, 35% in March 2024 and 32% in March 2023.
Ladner: Total Units Sold in March were 35, up from 26 (35%) in February, up from 5 (600%) in January, up from 31 (13%) in March 2025, up from 30 (17%) in March 2024, and down from 38 (8%) in March 2023; Active Listings were at 168 at month end compared to 158 at that time last year (up 6%) and 154 at the end of February (up 9%); the 76 New Listings in March were up 27% compared to February, up 6% compared to January, up 12% compared to March 2025, up 43% compared to March 2024 and up 10% compared to March 2023. Month’s supply of total residential listings is down to 5 months from 6 (balanced market conditions) and sales to listings ratio of 46% compared to 43% in February, 7% in January, 46% in March 2025, 57% in March 2024 and 55% in March 2023.
Tsawwassen: Total Units Sold in March were 30, up from 27 (11%) in February, up from 19 (58%) in January, down from 36 (17%) in March 2025, down from 34 (12%) in March 2024, and down from 35 (14%) in March 2023; Active Listings were at 297 at month end compared to 270 at that time last year (up 10%) and 275 at the end of February (up 8%); the 88 New Listings in March were down 10% compared to February, the same as January, down 11% compared to March 2025, up 24% compared to March 2024 and up 7% compared to March 2023. Month’s supply of total residential listings is steady at 10 months (buyer’s market conditions) and sales to listings ratio of 34% compared to 28% in February, 22% in January, 36% in March 2025, 48% in March 2024 and 43% in March 2023.
Fraser Valley: Sales in March were up 20% at 1,007 compared to February at 843 and were down 3% from March 2025 at 1,036. New listings were up 20% at 3,341 from February at 2,796 and down 12% from March 2025 at 3,800. The average price of $962,167 was up 5% month-over-month and was down 6% year-over-year. Active listings at 9,201 were up 10% compared to last month at 8,344 and down 0.2% from March 2025 at 9,219. Month’s supply of total residential listings is down to 9 months supply from 10 in February (buyer’s market conditions).