Highlights of Dexter’s February 2025 report
Sales in February down 11% year-over-year
New listings in February drop 9% from January
Active listings continue to accumulate at a slower rate
Tariff troubles begin
The year of political uncertainty continues. Tariff or not to tariff has been the question to start 2025 and continued through the month of February before culminating with a thud of tariffs on March 3. And while the hush that came across from buyers wasn’t all too unexpected, some sellers as well joined in the pause of activity in February. While sales in February were above the totals in January, new listing totals declined in February from January, not a common occurrence in the real estate market. It appears that the uncertainty around tariffs and interest rates affected the real estate market in February. This uncertainty may play out in the coming months, not to mention Canada’s own federal election coming this year. And the election promises are likely to impact what decisions people make with real estate. There is already talk of GST exemptions on new homes either up to $1M or $1.5M depending on which candidate wins, capital gains discussions and likely a push for supply from all sides. With 1.2 million mortgages up for renewal in 2025, some homeowners that have been afraid to make a move due to locked in low rates may now look to make that move they weren’t prepared to do as opposed to just renewing their mortgage.
Amidst all the political talk, the Bank of Canada will make their next interest rate decision on March 12th, with expectations somewhat mixed on whether another rate cut will happen. With tariffs now in place, the Bank of Canada may need to do another jumbo cut of at least 50 points. With inflation still below 2% and Canadian GDP sputtering along, the case is there for another rate cut by the Bank of Canada. And that’s even before considering the effects of tariffs. And when the economy suffers due to tariffs, expect the same to be considered when the Bank of Canada meets in April again.
There were 1,827 properties sold in Greater Vancouver in February after 1,552 properties sold in January, 1,765 properties sold in December, and 2,181 properties sold in November. The real estate market has undertones of a market wanting to move – literally. The increase in sales from January came amidst much political uncertainty and with fewer listings coming on the market in February compared to January. Cautiously moving forward, with buyers still having the advantage in today’s real estate market.
Greater Vancouver home sales lagged the previous year for the first time since September after a strong fourth quarter in 2024. No one should be surprised. Sales in February were down 11% compared to February 2024 with 2,070 homes sold and the same as February 2023 at 1,824 sales. This after January was 9% higher compared to the 1,427 properties sold in January 2024 and were a 51% increase from the 1,030 sales in January 2023. Heading east, the Fraser Valley region saw sales in February down 27% compared to February 2024 and at similar levels to February 2023.
Greater Vancouver sales in February were 39% below the 10-year average compared to January where sales were 29% below the 10-year average, December which was 12% below the 10-year average and November sales at 13% below the 10-year average. This was not a typical February, due mostly to uncertainty and partly due to weather with a 2-week cold snap which included snow (although nothing in comparison to the snow experienced in Eastern Canada.) Only fives times since the year 2000 have we seen less than 2,000 sales in Greater Vancouver for the month of February. Considering there were 4,051 sales in February 1989, this goes to show how few transactions are occurring given the increase in population and housing stocking over the last 35 years. People are holding on to the homes they buy, which exacerbates the lack of supply of available homes. And with a project in North Vancouver’s Lynn Canyon switching to all rental as opposed to a mix of rental and strata, there will be 205 fewer units available to purchase in that already supply starved market. At least Port Moody got the memo for more supply as they approved the first towers for its downtown core with over 1,000 units approved in 3 towers near the Moody Centre Sky Train station.
Sellers were less active in February, perhaps joining buyers on the side of uncertainty. There were 5,163 new listings in February, compared with 5,644 new listings that came on in January in Greater Vancouver. With sales levels still lagging through the first two months of the year, this might have kept some sellers taking a wait and see approach. But it was still well above the numbers of new listings compared to February last year which saw 4,651 come on and significantly more than the 3,559 new listings that came on the market in February 2023. The sales to listings ratio did rise in February, with 35% of new listings selling during the month, compared to 27% in January. But still below the 45% in February 2024 and 51% in February 2023. This points to more favourable conditions for buyers as well.
The number of new listings in February were 12% above the 10-year average, compared with January which saw the number of new listings 30% above the 10-year average and December was right at the 10-year average. There were properties listed in January that came off the market in late 2024 which added to the totals for that month and after seeing the slower start to the year and continued uncertainty, some sellers may have decided to wait and see if there are any impacts from the tariffs and resulting economic damage. March typically produces more new listings as the spring market kicks in. Even with the two-week school spring break, we’ll likely see more listings again this year compared to February but that could also depend on what the economic climate is like as we move through these tumultuous times. Predicting the future is subject to many variables so typical may not be part of the vocabulary for March this year.
There were 12,744 active listings in Greater Vancouver at month end, compared to 11,494 at the end of January. About 250 listings came off the market after the end of February, so March started with a lower total of active listings.
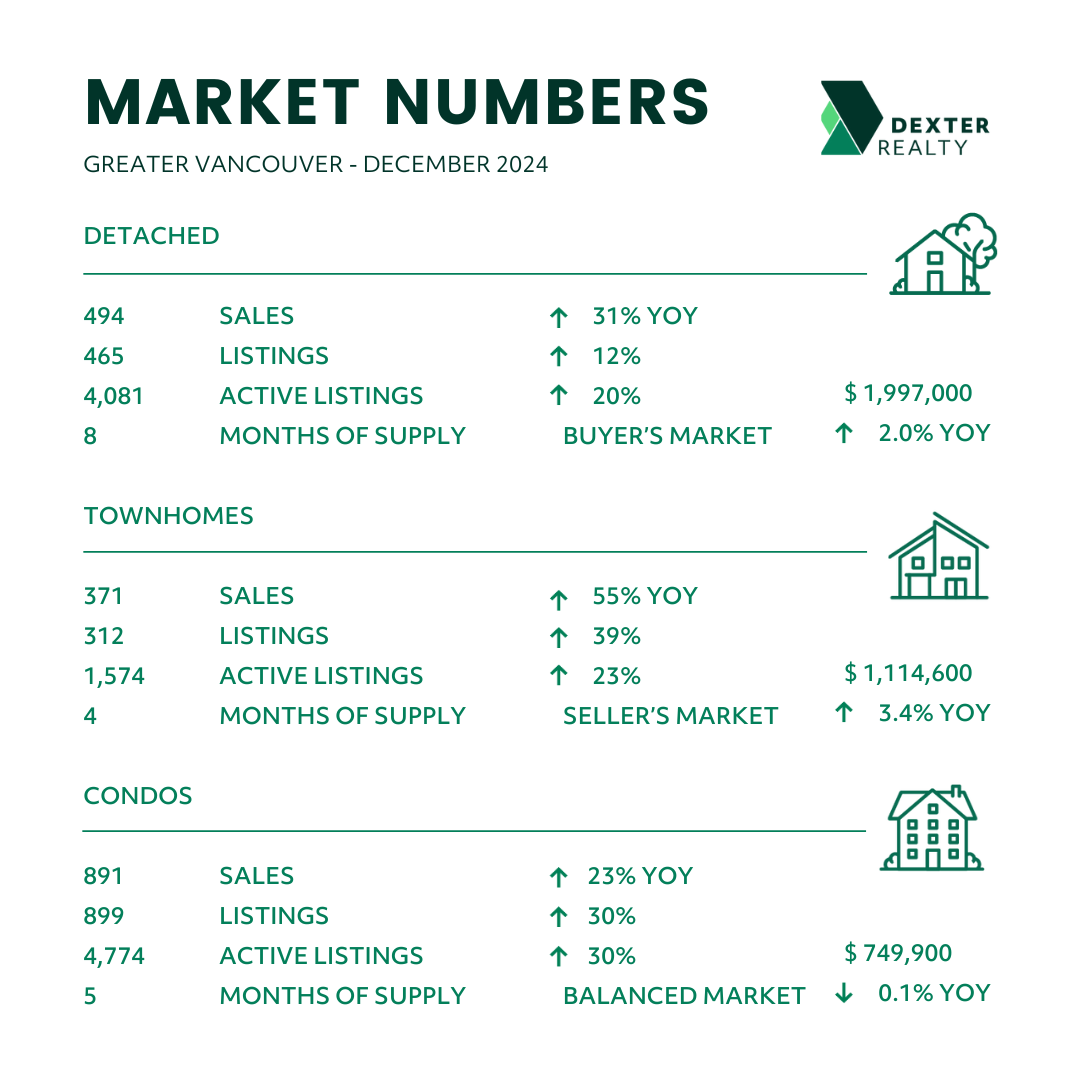
Months of supply remained at 7 months in Greater Vancouver due to less listings coming on in February. The detached market in Greater Vancouver dropped down to 9 from 11 months supply, compared to 8 months supply in December while townhomes stayed at 5 months after being at 4 months in December and condos also held, staying at 6 months after being at 5 months in December. The trend of townhome properties being the least available and most competitive continued. North Vancouver and Port Coquitlam remain in a seller’s market with only 4 months of supply with Burnaby North and Ladner dropping down to 4 months supply in the townhouse segment and Port Moody, Port Coquitlam, Pitt Meadows and Maple Ridge sitting with 2 months supply. Squamish saw a significant jump in sales in February and now sits with 2 months supply of townhouses while detached is at 3 months supply in Squamish.
Townhome sales in January for the region were up 10% compared to February last year, while condos sales were up 15% year-over-year. Detached sales lagged those product segments at 3% up from February last year. Townhome inventory overall was up 34% year-over year compared to 39% at the end of January, while condo inventory remained up 37% and detached homes were up 27% compared to 28% year-over-year at the end of January.
The Greater Vancouver real estate market in February 2025 reflected ongoing political and economic uncertainty, with tariffs taking effect on March 3 and interest rate decisions looming. While home sales increased from January, new listings declined, an unusual trend for the season. With a federal election and mortgage renewals on the horizon, market conditions remain unpredictable heading into spring. But after several years of below average activity, this is a market just waiting to move.
Here’s a summary of the numbers:
Greater Vancouver: Total Units Sold in February were 1,827 – up from 1,552 (18%) in January, up from 1,765 (4%) in December, down from 2,181 (16%) in November, down from 2,070 (11%) in February 2024, and up from 1,824 (0.1%) in February 2023; Active Listings were at 12,744 at month end compared to 10,552 at that time last year (up 32%) and 11,494 at the end of January (up 11%); the 5,163 New Listings in February were down 9% compared to January 2025, up 11% compared to February 2024, and up 45% compared to February 2023. Month’s supply of total residential listings is steady at 7 month’s supply (balanced market conditions) and sales to listings ratio of 35% compared to 27% in January, 45% in February 2024, and 51% in February 2023.
Month-over-month, the house price index is down 0.3% and in the last 6 months down 2.4%.
Vancouver Westside: Total Units Sold in February were 307 – up from 255 (20%) in January, the same as December, down from 383 (34%) in November, down from 374 (18%) in February 2024, and down from 316 (3%) in February 2023; Active Listings were at 2,780 at month end compared to 2,148 at that time last year (up 29%) and 2,548 at the end of January (up 9%); the 1,068 New Listings in February were down 9% compared to January 2025, up 14% compared to February 2024, and up 49% compared to February 2023. Month’s supply of total residential listings is down to 9 month’s supply from 10 (buyer’s market conditions) and sales to listings ratio of 28% compared to 22% in January, 40% in February 2024, and 44% in February 2023.
Month-over-month, the house price index is up 0.8% and in the last 6 months down 1.2%.
Vancouver East Side: Total Units Sold in February were 204 – up from 158 (29%) in January, up from 198 (3%) in December, down from 268 (24%) in November, down from 249 (18%) in February 2024, and up from 198 (3%) in February 2023; Active Listings were at 1,313 at month end compared to 1,109 at that time last year (up 18%) and 1,198 at the end of January (up 10%); the 567 New Listings in February were down 13% compared to January 2025, up 4% compared to February 2024, and up 48% compared to February 2023. Month’s supply of total residential listings is down to 6 month’s supply from 8 (balanced market conditions) and sales to listings ratio of 35% compared to 24% in January, 46% in February 2024, and 52% in February 2023.
Month-over-month, the house price index is up 0.5% and in the last 6 months down 0.5%.
North Vancouver: Total Units Sold in February were 153 – up from 148 (3%) in January, up from 138 (11%) in December, down from 173 (12%) in November, down from 163 (6%) in February 2024, and up from 150 (2%) in February 2023; Active Listings were at 684 at month end compared to 489 at that time last year (up 33%) and 596 at the end of January (up 15%); the 352 New Listings in February were down 15% compared to January 2025, up 3% compared to February 2024, and up 39% compared to February 2023. Month’s supply of total residential listings is steady at 4 month’s supply (seller’s market conditions) and sales to listings ratio of 43% compared to 34% in January, 48% in February 2024, and 59% in February 2023.
Month-over-month, the house price index is up 1.4% and in the last 6 months down 0.1%.
West Vancouver: Total Units Sold in February were 39 – up from 30 (30%) in January, the same in December, down from 45 (13%) in November, down from 56 (30%) in February 2024, and down from 43 (9%) in February 2023; Active Listings were at 580 at month end compared to 526 at that time last year (up 10%) and 541 at the end of January (up 7%); the 177 New Listings in February were down 10% compared to January 2025, up 4% compared to February 2024, and up 15% compared to February 2023. Month’s supply of total residential listings is down to 15 month’s supply from 18 (buyer’s market conditions) and sales to listings ratio of 22% compared to 15% in January, 33% in February 2024, and 28% in February 2023.
Month-over-month, the house price index is down 2.0% but in the last 6 months down 7.5%.
Richmond: Total Units Sold in February were 179 – down from 206 (13%) in January, down from 235 (24%) in December, down from 234 (24%) in November, down from 231 (23%) in February 2024, and down from 227 (21%) in February 2023; Active Listings were at 1,513 at month end compared to 1,088 at that time last year (up 39%) and 1,319 at the end of January (up 15%); the 599 New Listings in February were down 2% compared to January 2025, up 29% compared to February 2024, and up 30% compared to February 2023. Month’s supply of total residential listings is up to 8 month’s supply from 6 (buyer’s market conditions) and sales to listings ratio of 29% compared to 34% in January, 50% in February 2024, and 49% in February 2023.
Month-over-month, the house price index is down 0.2% and in the last 6 months down 2.7%.
Burnaby East: Total Units Sold in February were 21 – up from 17 (24%) in January, the same as December, down from 38 (45%) in November, down from 25 (16%) in February 2024, and the same as February 2023; Active Listings were at 153 at month end compared to 94 at that time last year (up 63%) and 135 at the end of January (up 13%); the 65 New Listings in February were down 23% compared to January 2025, up 8% compared to February 2024, and up 225% compared to February 2023. Month’s supply of total residential listings is down to 7 month’s supply from 8 (balanced market conditions) and sales to listings ratio of 32% compared to 20% in January, 42% in February 2024, and 105% in February 2023.
Month-over-month, the house price index is up 0.9% and in the last 6 months down 1.4%.
Burnaby North: Total Units Sold in February were 129 – up from 104 (24%) in January, down from 130 (1%) in December, down from 145 (10%) in November, up from 121 (7%) in February 2024, and down from 134 (4%) in February 2023; Active Listings were at 728 at month end compared to 447 at that time last year (up 63%) and 649 at the end of January (up 12%); the 322 New Listings in February were down 8% compared to January 2025, up 29% compared to February 2024, and up 58% compared to February 2023. Month’s supply of total residential listings is steady at 6 month’s supply (balanced market conditions) and sales to listings ratio of 40% compared to 30% in January, 49% in February 2024, and 66% in February 2023.
Month-over-month, the house price index is down 1.2% and in the last 6 months down 3.1%.
Burnaby South: Total Units Sold in February were 75 – up from 59 (27%) in January, down from 97 (23%) in December, down from 134 (40%) in November, down from 109 (31%) in February 2024, and down from 118 (36%) in February 2023; Active Listings were at 597 at month end compared to 425 at that time last year (up 40%) and 500 at the end of January (up 19%); the 248 New Listings in February were the same as January 2025, up 19% compared to February 2024, and up 20% compared to February 2023. Month’s supply of total residential listings is steady at 8 month’s supply (buyer’s market conditions) and sales to listings ratio of 30% compared to 24% in January, 52% in February 2024, and 57% in February 2023.
Month-over-month, the house price index is down 0.5% and in the last 6 months down 2.1%.
New Westminster: Total Units Sold in February were 88 – up from 61 (44%) in January, down from 96 (8%) in December, down from 93 (5%) in November, up from 79 (11%) in February 2024, and up from 66 (33%) in February 2023; Active Listings were at 448 at month end compared to 300 at that time last year (up 49%) and 404 at the end of January (up 11%); the 207 New Listings in February were down 10% compared to January 2025, up 8% compared to February 2024, and up 93% compared to February 2023. Month’s supply of total residential listings is down to 5 month’s supply from 7 (balanced market conditions) and sales to listings ratio of 42% compared to 27% in January, 41% in February 2024, and 62% in February 2023.
Month-over-month, the house price index is up 0.3% and in the last 6 months down 0.9%.
Coquitlam: Total Units Sold in February were 165 – up from 155 (6%) in January, up from 128 (29%) in December, down from 172 (4%) in November, down from 189 (13%) in February 2024, and up from 158 (2%) in February 2023; Active Listings were at 1,049 at month end compared to 599 at that time last year (up 75%) and 917 at the end of January (up 14%); the 472 New Listings in February were down 4% compared to January 2025, up 28% compared to February 2024, and up 99% compared to February 2023. Month’s supply of total residential listings is steady at 6 month’s supply (balanced market conditions) and sales to listings ratio of 34% compared to 32% in January, 51% in February 2024, and 67% in February 2023.
Month-over-month, the house price index is up 0.4% and in the last 6 months down 2.2%.
Port Moody: Total Units Sold in February were 40 – up from 32 (25%) in January, up from 29 (38%) in December, down from 63 (37%) in November, down from 46 (13%) in February 2024, and down from 47 (15%) in February 2023; Active Listings were at 233 at month end compared to 131 at that time last year (up 78%) and 184 at the end of January (up 26%); the 121 New Listings in February were up 10% compared to January 2025, up 49% compared to February 2024, and up 33% compared to February 2023. Month’s supply of total residential listings is steady at 6 month’s supply (balanced market conditions) and sales to listings ratio of 33% compared to 29% in January, 57% in February 2024, and 52% in February 2023.
Month-over-month, the house price index is down 1.0% and in the last 6 months down 5.3%.
Port Coquitlam: Total Units Sold in February were 58 – down from 65 (11%) in January, up from 51 (14%) in December, down from 76 (24%) in November, down from 64 (9%) in February 2024, and up from 40 (45%) in February 2023; Active Listings were at 262 at month end compared to 198 at that time last year (up 32%) and 236 at the end of January (up 11%); the 129 New Listings in February were down 13% compared to January 2025, up 13% compared to February 2024, and up 48% compared to February 2023. Month’s supply of total residential listings is up to 5 month’s supply from 4 (balanced market conditions) and sales to listings ratio of 44% compared to 44% in January, 43% in February 2024, and 46% in February 2023.
Month-over-month, the house price index is up 0.3% and in the last 6 months down 0.9%.
Pitt Meadows: Total Units Sold in February were 21 – up from 13 (62%) in January, down from 28 (25%) in December, down from 30 (30%) in November, down from 23 (8%) in February 2024, and up from 15 (40%) in February 2023; Active Listings were at 84 at month end compared to 64 at that time last year (up 31%) and 75 at the end of January (up 12%); the 44 New Listings in February were up 5% compared to January 2025, down 2% compared to February 2024, and up 63% compared to February 2023. Month’s supply of total residential listings is down to 4 month’s supply from 6 (seller’s market conditions) and sales to listings ratio of 47% compared to 30% in January, 51% in February 2024, and 55% in February 2023.
Month-over-month, the house price index is down 2.6% and in the last 6 months down 4.5%.
Maple Ridge: Total Units Sold in February were 129 – up from 95 (36%) in January, up from 112 (15%) in December, up from 116 (11%) in November, down from 145 (10%) in February 2024, and the same as February 2023; Active Listings were at 735 at month end compared to 678 at that time last year (up 8%) and 663 at the end of January (up 11%); the 313 New Listings in February were down 13% compared to January 2025, down 21% compared to February 2024, and up 50% compared to February 2023. Month’s supply of total residential listings is down to 6 month’s supply from 7 (balanced market conditions) and sales to listings ratio of 41% compared to 26% in January, 36% in February 2024, and 62% in February 2023.
Month-over-month, the house price index is down 1.8% and in the last 6 months down 3.1%.
Ladner: Total Units Sold in February were 29 – up from 17 (71%) in January, up from 14 (107%) in December, down from 33 (12%) in November, up from 23 (26%) in February 2024, and up from 27 (7%) in February 2023; Active Listings were at 146 at month end compared to 82 at that time last year (up 78%) and 134 at the end of January (up 9%); the 66 New Listings in February were down 15% compared to January 2025, up 78% compared to February 2024, and up 8% compared to February 2023. Month’s supply of total residential listings is down to 5 month’s supply from 8 (buyer’s market conditions) and sales to listings ratio of 43% compared to 22% in January, 62% in February 2024, and 44% in February 2023.
Month-over-month, the house price index is up 0.1% and in the last 6 months down 1.2%.
Tsawwassen: Total Units Sold in February were 28 – up from 26 (8%) in January, up from 21 (33%) in December, up from 26 (8%) in November, down from 38 (26%) in February 2024, and up from 25 (12%) in February 2023; Active Listings were at 245 at month end compared to 156 at that time last year (up 57%) and 216 at the end of January (up 13%); the 98 New Listings in February were down 8% compared to January 2025, up 31% compared to February 2024, and up 85% compared to February 2023. Month’s supply of total residential listings is up to 9 month’s supply (buyer’s market conditions) and sales to listings ratio of 28% compared to 24% in January, 51% in February 2024, and 47% in February 2023.
Month-over-month, the house price index is up 1.3% and in the last 6 months down 2.7%.
Fraser Valley: Sales in February were up 10%, compared to January and were down 27% from February 2024. New listings were down 8% from January and up 12% from February 2024.The average price was down 1% month-over-month and is up 0.4% year-over-year. Active listings were up 8% to 6,966 from 6,214 last month and up 39% from February 2024 which was at 4,997. Month’s supply of total residential listings remains at 8 months (buyer’s market conditions).
Month-over-month, the house price index is down 0.3% and in the last 6 months down 3.1%.