Market Insights

RSS

Promises, Promises.

Highlights of Dexter’s September 2024 report

  • Bank of Canada should cut its rate by 0.5% this month

  • 5th straight month of declining sales in Metro Vancouver

  • Highest number of Vancouver condo listings since 2012

  • Buy now before everyone else does when the rates come down further

September 2024 brought on promises and more promises. The Bank of Canada dropped their interest rate for the third consecutive time and by the end of the month the U.S. went ahead with their first rate cut – jumping right in with a half point drop. We’re now expecting a half point drop by the Bank of Canada in October based on the latest economic data. And if that wasn’t enough, the province is heading to the polls later in October with promise after promise from the incumbent NDP government and challenging Conservatives. Is it any wonder that buyers are waiting to see what happens? That was the tone of buyers in September, all while sellers jumped back into the market with another rush of listings. 

For the third consecutive meeting the Bank of Canada has reduced its key interest rate by a quarter point in September, bringing down mortgage costs for homeowners with variable rate mortgages and lines of credit. While not overly expected, there was some thought that a half point reduction was in order. But what this does now is leave the remaining two meetings open to further reductions in the Bank of Canada’s rate as the economy and inflation numbers clearly indicate that stimulus is needed. Expect both countries to use the remainder of the year to reduce their rates, with Canada going from the current 4.25% to 3.5% or lower by the time 2025 begins.

Many buyers may be thinking that significant Bank of Canada rate cuts will lead to equivalent reductions in fixed rates. But that’s not going to happen. Fixed rates are based on bond yields and current yields have factored in the anticipated drops in the Bank of Canada’s rate. That’s the reason why fixed rates have come down more than 1.5% from their highs already. With economic growth and inflation in Canada lagging, it’s become more likely that the Bank of Canada will cut quicker and deeper than anticipated, so expect variable rate mortgage costs to drop more than fixed rate mortgage costs. That means buyers looking for fixed rate mortgages aren’t going to gain by waiting. With the highest inventory of properties available in the last 6 years, opportunities exist for buyers more so than ever.

There were 1,852 properties sold in Greater Vancouver in September, after 1,903 sold in August, 2,333 properties sold in July, and 2,418 sold in June. With the highest number of active listings available since mid-2019, buyers are still in a holding pattern. Given the path to a sub 3 Bank of Canada rate by some time next year, variable rate mortgages are the flavour of buyers. Taking advantage of the increase in choice will allow those buyers brave enough to buy now and ride the rate down to beat out the competition that will come next spring. 

Sales in September were a 4% decrease from the 1,903 properties sold last year, after a 17% decrease in August from the 2,296 properties sold in August 2023. September typically sees a tepid start to the fall market, so less sales in the month after August is not unusual. Will it take another rate cut to further entice more buyers into the market? While the federal government’s promise to extend amortizations for all buyers of presales to 30% and increase of the threshold for insured mortgages to $1.5M gives promise to buyers for easing the mortgage pain, this won’t come until December. Just what the market needs, another reason to wait and push more into the spring market. Buy now or compete later is the mantra of this fall market.  

Sales in September were 26% below the 10-year average, like August with sales 26% below the 10-year average after July was 18% below the 10-year average and June was 24% below the 10-year average. The fall market has some work to do to eclipse the spring market in terms of activity but what’s clear is that the longer demand holds off, the busier it will be come the spring. With the inventory of listings continuing to rise, buyers have choice and opportunity like they haven’t seen since 2019. 

In Greater Vancouver the number of new listings in September were the highest totals since May after dropping to a low in August. With 6,228 new listings in September, this was a 48% jump from what came on the market in August and an increase of 11% compared to September 2023. Sellers were certainly ready to get into the fall market, even if buyers were still reluctant.

The number of new listings in September were 16% above the 10-year average after August was 1.5% below the 10-year average, July 12% above the 10-year average, and June 2% above the 10-year average. With 3 months left in the year, the total new listings so far are almost at the total for 2023 and will likely be the second highest annual amount in the last 10 years. Even with this, prices had remained relatively flat but are trending lower in the last few months, albeit in the 1 to 3% range for declines. The increase in listings will help keep prices in check as demand enters back into the market at a greater rate over the next year. 

There were 14,932 active listings in Greater Vancouver at month end, compared to 13,812 at the end of August, 14,325 at the end of July and 14,180 at the end of June. After being up 46% year-over-year at the end of May, currently there are 31% more active listings year-over-year, a drop from being at 37% at the end of August. While we did see a significant jump in active listings after the month of September, we’re still not at the highs we saw in 2019, although for the month of September we’d have to go back to 2014 to see an active listing count this high for the month of September. Count on total active listings climbing above 15,000 in Greater Vancouver as we move through October before declining through the rest of year. 

Overall, the detached market in Greater Vancouver is up to 11 months supply from 10 while townhomes remained at 6 months supply and condos climbed to 7 months from 6. Condos have seen the biggest increase in listings with there being 39% active listings year-over-year, with detached at 24% above the same time last year. Detached sales activity has slowed more so though, putting many areas into strong buyer’s markets with over 10 months supply. Vancouver westside condos are at the highest number of active listings since 2012 and sitting with 10 months supply – likely a result of rental legislation and short-term rental rules making that type of property a less attractive investment. Move over to the east side though and sales are up compared to last month and last year with their only being 5 months supply. That’s what a $200,000 difference in average price will do. 

As we move through October, election rhetoric and interest rate relief will be a distraction for many buyers. Affordability will continue to be the word thrown around by the two main parties in B.C. when referencing housing, but with so many regulations put in place by the current government, supply suffers at the hands of so many restrictions. Even with the promise to build more, we are still left with the question of how that’s going to happen.

Here’s a summary of the numbers:

Greater Vancouver: Total Units Sold in September were 1,852 – down from 1,903 (3%) in August, down from 2,333 (21%) in July, down from 2,418 (23%) in June, down from 1,93 (4%) in September 2023, up from 1,701 (9%) in September 2022, down from 3,200 (42%) in September 2021, down from 3,741 (50%) in September 2020, and down from 2,363 (22%) in September 2019; Active Listings were at 14,932 at month end compared to 11,382 at that time last year (up 31%) and 13,812 at the end of August (up 8%); the 6,228 New Listings in September were up 48% compared to August 2024, up 14% compared to September 2023, up 43% compared to September 2022, up 17% compared to September 2021, down 6% compared to September 2020, and up 24% compared to September 2019. Month’s supply of total residential listings is up to 8 month’s supply from 7 (buyer’s market conditions) and sales to listings ratio of 30% compared to 45% in August 2024, 35% in September 2023, and 39% in September 2022. 

Month-over-month, the house price index is down 1.4% and in the last 6 months down 1.6%.

Vancouver Westside: Total Units Sold in September were 312 – down from 337 (7%) in August, down from 416 (25%) in July, down from 470 (34%) in June, down from 338 (8%) in September 2023, up from 301 (4%) in September 2022, down from 567 (45%) in September 2021, down from 539 (42%) in September 2020, and down from 404 (23%) in September 2019; Active Listings were at 3,174 at month end compared to 2,558 at that time last year (up 24%) and 2,873 at the end of August (up 10%); the 1,302 New Listings in September were up 69% compared to August 2024, up 57% compared to September 2023, up 43% compared to September 2022, up 5% compared to September 2021, down 4% compared to September 2020, and up 31% compared to September 2019. Month’s supply of total residential listings is up to 10 month’s supply from 9 (buyer’s market conditions) and sales to listings ratio of 24% compared to 44% in August 2024, 29% in September 2023, and 33% in September 2022.

Month-over-month, the house price index is down 1.2% and in the last 6 months up 0.4%. 

Vancouver East Side: Total Units Sold in September were 211 – up from 193 (9%) in August, down from 263 (20%) in July, down from 270 (22%) in June, up from 192 (10%) in September 2023, up from 178 (19%) in September 2022, down from 368 (43%) in September 2021, down from 443 (52%) in September 2020, and down from 293 (28%) in September 2019; Active Listings were at 1,529 at month end compared to 1,196 at that time last year (up 27%) and 1,407 at the end of August (up 8%); the 772 New Listings in September were up 67% compared to August 2024, up 22% compared to September 2023, up 71% compared to September 2022, up 22% compared to September 2021, down 7% compared to September 2020, and up 33% compared to September 2019. Month’s supply of total residential listings is steady at 7 month’s supply (balanced market conditions) and sales to listings ratio of 28% compared to 42% in August 2024, 31% in September 2023, and 40% in September 2022.

Month-over-month, the house price index is down 1.3% and in the last 6 months down 0.4%. 

North Vancouver: Total Units Sold in September were 144 – down from 145 (1%) in August, down from 201 (28%) in July, down from 221 (35%) in June, down from 169 (15%) in September 2023, up from 128 (13%) in September 2022, down from 230 (37%) in September 2021, down from 328 (56%) in September 2020, and down from 166 (13%) in September 2019; Active Listings were at 856 at month end compared to 627 at that time last year (up 36%) and 675 at the end of August (up 27%); the 543 New Listings in September were up 102% compared to August 2024, up 13% compared to September 2023, up 35% compared to September 2022, up 29% compared to September 2021, down 8% compared to September 2020, and up 21% compared to September 2019. Month’s supply of total residential listings is up to 6 month’s supply from 5 (balanced market conditions) and sales to listings ratio of 27% compared to 54% in August 2024, 35% in September 2023, and 32% in September 2022.

Month-over-month, the house price index is down 2.5% and in the last 6 months down 3.1%. 

West Vancouver: Total Units Sold in September were 45 – down from 57 (21%) in August, down from 59 (24%) in July, down from 75 (40%) in June, down from 53 (15%) in September 2023, up from 42 (7%) in September 2022, down from 71 (37%) in September 2021, down from 98 (54%) in September 2020, and down from 51 (12%) in September 2019; Active Listings were at 724 at month end compared to 626 at that time last year (up 31%) and 678 at the end of August (up 8%); the 237 New Listings in September were up 71% compared to August 2024, down 8% compared to September 2023, up 21% compared to September 2022, up 9% compared to September 2021, up 13% compared to September 2020, and up 1% compared to September 2019. Month’s supply of total residential listings is up to 16 month’s supply from 12 (buyer’s market conditions) and sales to listings ratio of 19% compared to 42% in August 2024, 21% in September 2023, and 22% in September 2022.

Month-over-month, the house price index is down 3.0% but in the last 6 months down 2.8%. 

Richmond: Total Units Sold in September were 197 – up from 191 (3%) in August, down from 255 (23%) in July, down from 263 (25%) in June, down from 256 (23%) in September 2023, down from 210 (6%) in September 2022, down from 432 (54%) in September 2021, down from 415 (53%) in September 2020, and down from 283 (30%) in September 2019; Active Listings were at 1,736 at month end compared to 1,268 at that time last year (up 37%) and 1,632 at the end of August (up 6%); the 629 New Listings in September were up 16% compared to August 2024, up 4% compared to September 2023, up 35% compared to September 2022, up 0.5% compared to September 2021, down 10% compared to September 2020, and up 12% compared to September 2019. Month’s supply of total residential listings is steady at 9 month’s supply (balanced market conditions) and sales to listings ratio of 31% compared to 35% in August 2024, 43% in September 2023, and 45% in September 2022.

Month-over-month, the house price index is down 1.2% and in the last 6 months down 2.5%. 

Burnaby East: Total Units Sold in September were 29 – up from 25 (16%) in August, down from 33 (12%) in July, up from 17 (71%) in June, up from 18 (61%) in September 2023, up from 17 (18%) in September 2022, down from 38 (24%) in September 2021, down from 41 (29%) in September 2020, and up from 22 (32%) in September 2019; Active Listings were at 148 at month end compared to 96 at that time last year (up 54%) and 140 at the end of August (up 6%); the 67 New Listings in September were up 37% compared to August 2024, up 37% compared to September 2023, up 148% compared to September 2022, up 37% compared to September 2021, up 22% compared to September 2020, and up 20% compared to September 2019. Month’s supply of total residential listings is down to 5 month’s supply from 6 (balanced market conditions) and sales to listings ratio of 43% compared to 51% in August 2024, 37% in September 2023, and 63% in September 2022.

Month-over-month, the house price index is down 1.4% and in the last 6 months down 2.4%. 

Burnaby North: Total Units Sold in September were 122 – down from 145 (16%) in August, down from 137 (11%) in July, down from 172 (29%) in June, up from 113 (8%) in September 2023, up from 111 (10%) in September 2022, down from 189 (47%) in September 2021, down from 192 (36%) in September 2020, and down from 138 (6%) in September 2019; Active Listings were at 839 at month end compared to 561 at that time last year (up 49%) and 826 at the end of August (up 1%); the 339 New Listings in September were up 15% compared to August 2024, up 11% compared to September 2023, up 73% compared to September 2022, down 12% compared to September 2021, down 3% compared to September 2020, and up 34% compared to September 2019. Month’s supply of total residential listings is up to 7 month’s supply from 6 (balanced market conditions) and sales to listings ratio of 36% compared to 49% in August 2024, 37% in September 2023, and 57% in September 2022.

Month-over-month, the house price index is down 1.5% and in the last 6 months down 2.1%. 

Burnaby South: Total Units Sold in September were 114 – up from 112 (2%) in August, down from 140 (19%) in July, down from 135 (16%) in June, down from 126 (10%) in September 2023, up from 96 (19%) in September 2022, down from 183 (38%) in September 2021, down from 173 (34%) in September 2020, and down from 119 (4%) in September 2019; Active Listings were at 694 at month end compared to 518 at that time last year (up 34%) and 634 at the end of August (up 9%); the 332 New Listings in September were up 49% compared to August 2024, up 18% compared to September 2023, up 53% compared to September 2022, up 16% compared to September 2021, down 8% compared to September 2020, and up 42% compared to September 2019. Month’s supply of total residential listings is steady at 6 month’s supply (balanced market conditions) and sales to listings ratio of 35% compared to 51% in August 2024, 45% in September 2023, and 44% in September 2022.

Month-over-month, the house price index is down 3.4% and in the last 6 months down 4.3%. 

New Westminster: Total Units Sold in September were 73 – down from 79 (8%) in August, down from 98 (26%) in July, down from 108 (32%) in June, up from 72 (1%) in September 2023, up from 67 (9%) in September 2022, down from 131 (44%) in September 2021, down from 176 (59%) in September 2020, and down from 110 (34%) in September 2019; Active Listings were at 468 at month end compared to 298 at that time last year (up 57%) and 406 at the end of August (up 15%); the 242 New Listings in September were up 69% compared to August 2024, up 39% compared to September 2023, up 40% compared to September 2022, up 3% compared to September 2021, down 24% compared to September 2020, and up 11% compared to September 2019. Month’s supply of total residential listings is up to 6 month’s supply from 5 (balanced market conditions) and sales to listings ratio of 30% compared to 56% in August 2024, 42% in September 2023, and 39% in September 2022.

Month-over-month, the house price index is up 0.6% and in the last 6 months down 0.3%. 

Coquitlam: Total Units Sold in September were 155 – down from 171 (9%) in August, down from 178 (13%) in July, down from 189 (18%) in June, down from 170 (9%) in September 2023, up from 142 (9%) in September 2022, down from 247 (37%) in September 2021, down from 307 (50%) in September 2020, and down from 213 (27%) in September 2019; Active Listings were at 1,146 at month end compared to 713 at that time last year (up 61%) and 1,052 at the end of August (up 9%); the 512 New Listings in September were up 22% compared to August 2024, up 15% compared to September 2023, up 58% compared to September 2022, up 43% compared to September 2021, the same as September 2020, and up 34% compared to September 2019. Month’s supply of total residential listings is up to 7 month’s supply from 6 (balanced market conditions) and sales to listings ratio of 30% compared to 41% in August 2024, 38% in September 2023, and 44% in September 2022.

Month-over-month, the house price index is down 1.5% and in the last 6 months down 3.0%. 

Port Moody: Total Units Sold in September were 61 – up from 39 (56%) in August, up from 58 (5%) in July, up from 56 (9%) in June, up from 44 (39%) in September 2023, up from 53 (15%) in September 2022, down from 69 (12%) in September 2021, down from 88 (31%) in September 2020, and up from 49 (24%) in September 2019; Active Listings were at 251 at month end compared to 185 at that time last year (up 36%) and 243 at the end of August (up 3%); the 143 New Listings in September were up 59% compared to August 2024, up 38% compared to September 2023, up 61% compared to September 2022, up 46% compared to September 2021, down 14% compared to September 2020, and up 51% compared to September 2019. Month’s supply of total residential listings is down to 4 month’s supply from 6 (seller’s market conditions) and sales to listings ratio of 43% compared to 43% in August 2024, 42% in September 2023, and 60% in September 2022

Month-over-month, the house price index is down 0.7% and in the last 6 months up 2.4%. 

Port Coquitlam: Total Units Sold in September were 52 – down from 56 (7%) in August, down from 66 (21%) in July, down from 62 (16%) in June, down from 65 (20%) in September 2023, up from 50 (4%) in September 2022, down from 97 (46%) in September 2021, down from 114 (54%) in September 2020, and down from 78 (33%) in September 2019; Active Listings were at 358 at month end compared to 191 at that time last year (up 87%) and 306 at the end of August (up 17%); the 186 New Listings in September were up 81% compared to August 2024, up 33% compared to September 2023, up 49% compared to September 2022, up 28% compared to September 2021, down 7% compared to September 2020, and up 28% compared to September 2019. Month’s supply of total residential listings is up to 7 month’s supply from 5 (balanced market conditions) and sales to listings ratio of 28% compared to 55% in August 2024, 47% in September 2023, and 40% in September 2022.

Month-over-month, the house price index is down 2.1% and in the last 6 months down 1.6%. 

Pitt Meadows: Total Units Sold in September were 24 – up from 21 (14%) in August, down from 27 (11%) in July, down from 28 (14%) in June, the same as September 2023, up from 20 (20%) in September 2022, down from 41 (41%) in September 2021, down from 44 (45%) in September 2020, and down from 32 (25%) in September 2019; Active Listings were at 125 at month end compared to 94 at that time last year (up 32%) and 105 at the end of August (up 19%); the 70 New Listings in September were up 75% compared to August 2024, up 29% compared to September 2023, up 27% compared to September 2022, up 59% compared to September 2021, down 9% compared to September 2020, and up 19% compared to September 2019. Month’s supply of total residential listings is steady at 5 month’s supply (balanced market conditions) and sales to listings ratio of 34% compared to 52% in August 2024, 44% in September 2023, and 36% in September 2022.  

Month-over-month, the house price index is down 1.5% and in the last 6 months down 3.1%.

Maple Ridge: Total Units Sold in September were 114 – down from 123 (7%) in August, down from 166 (31%) in July, down from 130 (12%) in June, up from 108 (6%) in September 2023, down from 115 (1%) in September 2022, down from 182 (37%) in September 2021, down from 267 (57%) in September 2020, and down from 157 (27%) in September 2019; Active Listings were at 887 at month end compared to 752 at that time last year (up 17%) and 855 at the end of August (up 4%); the 344 New Listings in September were up 24% compared to August 2024, down 4% compared to September 2023, up 22% compared to September 2022, up 50% compared to September 2021, up 14% compared to September 2020, and up 21% compared to September 2019. Month’s supply of total residential listings is up to 8 month’s supply from 7 (buyer’s market conditions) and sales to listings ratio of 33% compared to 44% in August 2024, 30% in September 2023, and 40% in September 2022.

Month-over-month, the house price index is down 0.7% and in the last 6 months down 1.2%. 

Ladner: Total Units Sold in September were 22 – down from 25 (12%) in August, down from 31 (29%) in July, down from 27 (19%) in June, down from 26 (15%) in September 2023, up from 20 (10%) in September 2022, down from 38 (42%) in September 2021, down from 53 (58%) in September 2020, and down from 28 (21%) in September 2019; Active Listings were at 136 at month end compared to 117 at that time last year (up 16%) and 124 at the end of August (up 10%); the 73 New Listings in September were up 62% compared to August 2024, up 12% compared to September 2023, up 83% compared to September 2022, up 62% compared to September 2021, up 30% compared to September 2020, and up 33% compared to September 2019. Month’s supply of total residential listings is up to 6 month’s supply from 5 (balanced market conditions) and sales to listings ratio of 30% compared to 56% in August 2024, 40% in September 2023, and 50% in September 2022.

Month-over-month, the house price index is up 1.0% and in the last 6 months up 1.6%. 

Tsawwassen: Total Units Sold in September were 34 – up from 32 (6%) in August, down from 45 (24%) in July, down from 44 (23%) in June, down from 42 (35%) in September 2023, up from 21 (62%) in September 2022, down from 57 (40%) in September 2021, down from 80 (57%) in September 2020, and up from 26 (31%) in September 2019; Active Listings were at 215 at month end compared to 174 at that time last year (up 23%) and 199 at the end of August (up 7%); the 80 New Listings in September were up 32% compared to August 2024, up 7% compared to September 2023, up 36% compared to September 2022, up 8% compared to September 2021, down 32% compared to September 2020, and the same as September 2019. Month’s supply of total residential listings is steady at 6 month’s supply (buyer’s market conditions) and sales to listings ratio of 43% compared to 53% in August 2024, 57% in September 2023, and 36% in September 2022.

Month-over-month, the house price index is down 2.8% and in the last 6 months down 4.3%. 

Fraser Valley: Sales in September were down 8.0%, compared to August and were down 10.7% from September 2023. New listings were up 20.7% from August and up 17.2% from September 2023.The average price was down 2.3% month-over-month and is up 2.4% year-over-year. Active listings were up 4.9% to 9,045 from 8,626 last month and up 38.5% from September 2023 which was at 6,532. Month’s supply of total residential listings is up to 9 month’s supply from 8 (buyer’s market conditions).

“With three rate cuts already and more expected before the end of the year, buyers are watching the market closely to time their purchasing decisions,” said Jeff Chadha, Chair of the Fraser Valley Real Estate Board. “The current conditions should favour buyers, particularly in the detached market, however until we start to see some movement in asking prices, properties will continue to sit on the market for extended periods as both buyers and sellers await the next rate announcement.” 

Month-over-month, the house price index is down 1% and in the last 6 months 3%. 

Read

Has the Listing Parade Slowed Down?

Highlights of Dexter’s August 2024 report

  • Detached home sales in August down 18% to July

  • Active listing counts declined except for Richmond, Coquitlam and Port Moody

  • Lowest number of monthly sales since January

  • Buyers ready for more interest rate cuts

August 2024 was the month of taking a break! With sales and listing activity down, it felt like most were enjoying the weather and holiday time before September rolled around. After a thrust of listings over the last 5 months, there was a significant decline for August that left fewer homes on the market as we move into the fall market.

For the third consecutive meeting the Bank of Canada has reduced its key interest rate by a quarter point, bringing down mortgage costs for homeowners with variable rate mortgages and lines of credit. While not overly expected, there was some thought that a half point reduction could have come. But what this does now is leave the remaining two meetings open to further reductions in the Bank of Canada’s rate as the economy and inflation numbers clearly are indicating that stimulus is needed. Even though the United States Feds seemed steadfast in keeping their rate unchanged for the remainder of 2024 earlier in the summer, they have now signalled that there will be a rate cut in September at their meeting on the 17th. Expect both countries to use the remainder of the year to reduce their rates, with Canada going from the current 4.5% to 3.75% or even 3.5% by the time 2025 begins.

Of course, fixed rate mortgages are affected by bond yields, and after hitting a high of 4.46% in 2023 the 5-year Canada bond rate then dropped down to 2.9% in July and is just over 3.0% now. This likely means fixed interested rates won’t see much change from the Bank of Canada interest rate cut in September as bond markets typically predict what’s going to happen and thus bond rates are priced accordingly. Meaning, everyone is expecting a rate cut. But as the fall moves forward expect fixed rates to see movement downward as the Bank of Canada is predicted to continue its downward trajectory. All this means, mortgage costs will come down, and buyers will have more incentive to go back into the market. And with 2025 coming, we’ll start to see 5-year mortgages come up for renewal that were locked in to record low rates. The disincentive to sell could be off the table for those with expiring “cheap rate” mortgages and create more transactional activity in the real estate market.

There were 1,903 properties sold in Greater Vancouver in August after 2,333 properties sold in July, 2,418 sold in June, 2,733 sold in May, and 2,831 sold in April. Buyers have signalled they want more interest rate relief with the total number of sales declining month over month for the fourth straight time. And they are about to get it. What will be the tipping point to move buyers back into the market at a greater pace? We’ll likely see that this fall. Sales in August were a 17% decrease from the 2,296 properties sold last year after a 5% decease in July from the 2,455 properties sold in July 2023, and a 19% decrease in June from the 2,988 properties sold in June 2023. Last summer buyers faced the shock of two sudden Bank of Canada interest rate increases which brought sales activity quickly down after a robust spring in 2023. To see sales levels at this level after two rate reductions points to a deep pool of buyers waiting. Economic uncertainty certainly weighs on the market with unemployment rates rising and overall spending being held in check. All signs point to a market that will see demand unleash, but it’s a question of when. Buyers are likely saying “Show me the rate reductions” before fully embracing this buyer’s market.

Sales in August were 26% below the 10-year average after July was 18% below the 10-year average and June was 24% below the 10-year average. This trend will be changing in the months ahead as buyers get behind interest rate reductions. Like 2019, the fall market will be more active than spring. We’ve seen an increase in listings albeit not as many as 2019, and how many listings come out in the fall will dictate where prices go over the next 6 months. 

With the number of new listings dropping for the fourth straight month, the absorption rate increased to 45%, the highest percentage since March. Even with the lower number of sales, fewer listings were added to the overall active listing count. And with approximately 400 listings expiring at the end of August, that total dropped even more at the start of September. Greater Vancouver is pushed up to 7 months of inventory, closer to a buyer’s market, after being at 6 months and lower all year. All areas in Greater Vancouver have shifted into balanced to buyer’s markets after North Vancouver, New Westminster, Port Moody, Ladner and Pitt Meadows being the only areas in a seller’s market prior to August. This is mainly due to falling sales in those areas. Vancouver’s Westside and Richmond joined West Vancouver in buyer’s market territory due to their drop in total sales along with higher active listing counts. There may be areas and product types that act differently either with stronger activity or less activity. It’s not unusual to see multiple offers on Vancouver’s Westside detached while condo apartments downtown sit without any offers. 

The number of new listings dropped again in August, the biggest month over month decline this year. After seeing 7,229 in April, 6,484 new listings in May, 5,851 new listings in June, 5,689 new listings in July, the total for August was 4,199.

While the number of new listings declined month-over-month, there were slightly more new listings in August this year compared to that month in 2023. In Augst 2023 there were 4,015 new listings, 5% more than August last year. August typically sees the real estate market less active, to it’s not completely surprising to see fewer new listings come on but after a higher number in July, it perhaps could be a trend of less seller activity through the remainder of 2024. 

The number of new listings in August were 1.5% below the 10-year average, after seeing July at 12% above the 10-year average, June at 2% above the 10-year average, May at 7% above the 10-year average and April at 29% above the 10-year average. Even with the summer slowdown, August produced less listings than typical for this month. 

There were 13,812 active listings in Greater Vancouver at month end, compared to 14,325 at the end of July and 14,180 at the end of June. After being up 46% year-over-year at the end of May, currently there are 37% more new listings year-over-year. After the end of August, September started with 13,444 with listings expiring at the end of August or sellers simply taking them off the market. In 2019, there was a similar pattern, with the active listing count going from 15,037 at the end of July to 14,191 at the end of August and continuing to decline for the remainder of the year to finish with 9,309. We’ve likely seen the number of active listings peak in 2024 and as we move through the remainder of the year, buyer choice will likely decline. 

Overall the detached market in Greater Vancouver is up to 10 months supply from 8 while townhomes and condos both jumped up to 6 from 5 months supply making it a balanced to buyer’s market in the region. Detached homes are showing less buyer engagement while townhouses and condos are in some areas still in a seller’s market. With cost control on the minds of buyers, it’s not surprising to see lower priced properties being more attractive in the market. 

The biggest movement in B.C. in August was the shift in the political landscape with the leader of the B.C. United party stepping his party away from the election race. It’s now a two-horse race. Housing is sure to be a significant part of the campaign for both parties, but will either party have a viable solution for increasing supply? For 8 years the NDP government has moved the needle very little even with significant regulatory and legislative changes to property rights and municipal zoning requirements. Investment in housing has been pushed away, without considering that small scale investors provide rental stock at a pace far greater than government can. And while the push has been to build more purpose-built rental buildings it has come at the cost of multi-family units for ownership. This will have long-term effects for buyers and future private rentals in the years to come. Supply and demand shouldn’t be ignored but unfortunately supply is being stifled for future buyers with current policies as well as current economic conditions.

Here’s a summary of the numbers:

Greater Vancouver: Total Units Sold in August were 1,903 – down from 2,333 (18%) in July, down from 2,418 (21%) in June, down from 2,296 (17%) in August 2023, up from 1,892 (1%) in August 2022, down from 3,166 (40%) in August 2021, down from 3,122 (39%) in August 2020, and down from 2,256 (16%) in August 2019; Active Listings were at 13,812 at month end compared to 10,082 at that time last year (up 37%) and 14,326 at the end of July (down 4%); New Listings in August were down 26% compared to July 2024, up 5% compared to August 2023, up 24% compared to August 2022, up 2% compared to August 2021, down 30% compared to August 2020, and up 9% compared to August 2019. Month’s supply of total residential listings is up to 7 month’s supply from 6 (balanced market conditions) and sales to listings ratio of 45% compared to 41% in July 2024, 57% in August 2023, and 56% in August 2022. 

Month-over-month, the house price index is down 0.1% and in the last 6 months up 1.2%.

Vancouver Westside: Total Units Sold in August were 337 – down from 416 (19%) in July, down from 470 (28%) in June, down from 433 (22%) in August 2023, down from 380 (11%) in August 2022, down from 593 (38%) in August 2021, down from 490 (31%) in August 2020, and down from 423 (20%) in August 2019; Active Listings were at 2,873 at month end compared to 2,294 at that time last year (up 25%) and 3,040 at the end of July (down 5%); New Listings in August were down 33% compared to July 2024, down 7% compared to August 2023, up 5% compared to August 2022, down 16% compared to August 2021, down 36% compared to August 2020, and up 20% compared to August 2019. Month’s supply of total residential listings is up to 9 month’s supply from 7 (buyer’s market conditions) and sales to listings ratio of 44% compared to 37% in July 2024, 53% in August 2023, and 52% in August 2022.

Month-over-month, the house price index is down 0.3% and in the last 6 months up 1.9%. 

Vancouver East Side: Total Units Sold in August were 193 – down from 263 (27%) in July, down from 270 (29%) in June, down from 250 (23%) in August 2023, down from 196 (2%) in August 2022, down from 295 (35%) in August 2021, down from 330 (42%) in August 2020, and down from 235 (18%) in August 2019; Active Listings were at 1,407 at month end compared to 1,013 at that time last year (up 39%) and 1,468 at the end of July (down 4%); New Listings in August were down 23% compared to July 2024, up 20% compared to August 2023, up 38% compared to August 2022, up 7% compared to August 2021, down 38% compared to August 2020, and up 27% compared to August 2019. Month’s supply of total residential listings is up to 7 month’s supply from 6 (balanced market conditions) and sales to listings ratio of 42% compared to 44% in July 2024, 66% in August 2023, and 59% in August 2022.

Month-over-month, the house price index is up 0.3% and in the last 6 months up 1.9%. 

North Vancouver: Total Units Sold in August were 145 – down from 201 (28%) in July, down from 221 (34%) in June, down from 160 (9%) in August 2023, up from 126 (15%) in August 2022, down from 212 (32%) in August 2021, down from 239 (39%) in August 2020, and down from 184 (21%) in August 2019; Active Listings were at 675 at month end compared to 498 at that time last year (up 36%) and 740 at the end of July (down 9%); New Listings in August were down 37% compared to July 2024, up 5% compared to August 2023, up 19% compared to August 2022, up 9% compared to August 2021, down 45% compared to August 2020, and up 2% compared to August 2019. Month’s supply of total residential listings is up to 5 month’s supply from 4 (balanced market conditions) and sales to listings ratio of 54% compared to 47% in July 2024, 63% in August 2023, and 56% in August 2022.

Month-over-month, the house price index is down 1.3% and in the last 6 months up 0.6%. 

West Vancouver: Total Units Sold in August were 57 – down from 59 (3%) in July, down from 75 (24%) in June, the same as 57 in August 2023, up from 53 (8%) in August 2022, down from 67 (15%) in August 2021, down from 67 (15%) in August 2020, and up from 49 (16%) in August 2019; Active Listings were at 678 at month end compared to 582 at that time last year (up 16%) and 733 at the end of July (down 8%); New Listings in August were down 37% compared to July 2024, down 8% compared to August 2023, down 11% compared to August 2022, up 5% compared to August 2021, down 30% compared to August 2020, and the same as August 2019. Month’s supply of total residential listings is steady at 12 month’s supply (buyer’s market conditions) and sales to listings ratio of 42% compared to 27% in July 2024, 39% in August 2023, and 35% in August 2022.

Month-over-month, the house price index is up 0.8% but in the last 6 months up 4.3%. 

Richmond: Total Units Sold in August were 191 – down from 255 (25%) in July, down from 263 (27%) in June, down from 319 (40%) in August 2023, down from 226 (15%) in August 2022, down from 440 (57%) in August 2021, down from 340 (44%) in August 2020, and down from 250 (24%) in August 2019; Active Listings were at 1,632 at month end compared to 1,162 at that time last year (up 40%) and 1,563 at the end of July (up 4%); New Listings in August were down 15% compared to July 2024, up 9% compared to August 2023, up 44% compared to August 2022, up 1% compared to August 2021, down 19% compared to August 2020, and up 5% compared to August 2019. Month’s supply of total residential listings is up to 9 month’s supply from 6 (buyer’s market conditions) and sales to listings ratio of 35% compared to 40% in July 2024, 64% in August 2023, and 60% in August 2022.

Month-over-month, the house price index is up 0.7% and in the last 6 months down 0.3%. 

Burnaby East: Total Units Sold in August were 25 – down from 33 (24%) in July, up from 17 (47%) in June, down from 31 (19%) in August 2023, up from 20 (25%) in August 2022, down from 29 (14%) in August 2021, down from 37 (32%) in August 2020, and down from 31 (19%) in August 2019; Active Listings were at 140 at month end compared to 83 at that time last year (up 69%) and 160 at the end of July (down 12%); New Listings in August were down 23% compared to July 2024, up 29% compared to August 2023, up 81% compared to August 2022, down 4% compared to August 2021, down 23% compared to August 2020, and down 8% compared to August 2019. Month’s supply of total residential listings is up to 6 month’s supply from 5 (balanced market conditions) and sales to listings ratio of 51% compared to 52% in July 2024, 82% in August 2023, and 74% in August 2022.

Month-over-month, the house price index is down 0.1% and in the last 6 months up 0.1%. 

Burnaby North: Total Units Sold in August were 145 – up from 137 (6%) in July, down from 172 (16%) in June, up from 139 (4%) in August 2023, up from 120 (21%) in August 2022, down from 181 (20%) in August 2021, down from 197 (26%) in August 2020, and up from 129 (12%) in August 2019; Active Listings were at 826 at month end compared to 495 at that time last year (up 67%) and 837 at the end of July (down 1%); New Listings in August were down 26% compared to July 2024, up 13% compared to August 2023, up 54% compared to August 2022, up 23% compared to August 2021, down 16% compared to August 2020, and up 38% compared to August 2019. Month’s supply of total residential listings is steady at 6 month’s supply (balanced market conditions) and sales to listings ratio of 49% compared to 35% in July 2024, 54% in August 2023, and 63% in August 2022.

Month-over-month, the house price index is down 0.6% and in the last 6 months up 0.7%. 

Burnaby South: Total Units Sold in August were 112 – down from 140 (20%) in July, down from 135 (17%) in June, down from 133 (16%) in August 2023, down from 123 (9%) in August 2022, down from 199 (44%) in August 2021, down from 130 (14%) in August 2020, and down from 126 (19%) in August 2019; Active Listings were at 634 at month end compared to 445 at that time last year (up 42%) and 682 at the end of July (down 7%); New Listings in August were down 21% compared to July 2024, up 4% compared to August 2023, up 31% compared to August 2022, down 21% compared to August 2021, down 29% compared to August 2020, and down 19% compared to August 2019. Month’s supply of total residential listings is up to 6 month’s supply from 5 (balanced market conditions) and sales to listings ratio of 51% compared to 50% in July 2024, 62% in August 2023, and 73% in August 2022.

Month-over-month, the house price index is down 0.1% and in the last 6 months up 0%. 

New Westminster: Total Units Sold in August were 79 – down from 98 (19%) in July, down from 108 (27%) in June, down from 87 (9%) in August 2023, up from 77 (3%) in August 2022, down from 146 (46%) in August 2021, down from 161 (51%) in August 2020, and down from 97 (19%) in August 2019; Active Listings were at 406 at month end compared to 299 at that time last year (up 36%) and 428 at the end of July (down 5%); New Listings in August were down 32% compared to July 2024, down 8% compared to August 2023, up 19% compared to August 2022, down 14% compared to August 2021, down 50% compared to August 2020, and down 14% compared to August 2019. Month’s supply of total residential listings is up to 5 month’s supply from 4 (balanced market conditions) and sales to listings ratio of 56% compared to 47% in July 2024, 56% in August 2023, and 65% in August 2022.

Month-over-month, the house price index is up 1.3% and in the last 6 months up 0.4%. 

Coquitlam: Total Units Sold in August were 171 – down from 178 (4%) in July, down from 189 (10%) in June, down from 203 (16%) in August 2023, up from 157 (9%) in August 2022, down from 284 (40%) in August 2021, down from 246 (30%) in August 2020, and down from 198 (14%) in August 2019; Active Listings were at 1,052 at month end compared to 599 at that time last year (up 76%) and 1,057 at the end of July (up 0.5%); New Listings in August were down 16% compared to July 2024, up 43% compared to August 2023, up 60% compared to August 2022, up 38% compared to August 2021, up 3% compared to August 2020, and up 20% compared to August 2019. Month’s supply of total residential listings is steady at 6 month’s supply (balanced market conditions) and sales to listings ratio of 41% compared to 35% in July 2024, 69% in August 2023, and 59% in August 2022.

Month-over-month, the house price index is down 0.6% and in the last 6 months down 0.7%. 

Port Moody: Total Units Sold in August were 39 – down from 58 (33%) in July, down from 56 (30%) in June, down from 58 (33%) in August 2023, up from 33 (18%) in August 2022, down from 57 (32%) in August 2021, down from 86 (55%) in August 2020, and the same amount in August 2019; Active Listings were at 243 at month end compared to 167 at that time last year (up 46%) and 238 at the end of July (up 2%); New Listings in August were down 20% compared to July 2024, up 17% compared to August 2023, up 17% compared to August 2022, up 15% compared to August 2021, down 24% compared to August 2020, and up 18% compared to August 2019. Month’s supply of total residential listings is up to 6 month’s supply from 4 (balanced market conditions) and sales to listings ratio of 43% compared to 52% in July 2024, 75% in August 2023, and 43% in August 2022.

Month-over-month, the house price index is down 0.2% and in the last 6 months up 3.6%. 

Port Coquitlam: Total Units Sold in August were 56 – down from 66 (15%) in July, down from 62 (10%) in June, down from 69 (19%) in August 2023, up from 78 (28%) in August 2022, down from 97 (43%) in August 2021, down from 169 (67%) in August 2020, and down from 79 (29%) in August 2019; Active Listings were at 306 at month end compared to 169 at that time last year (up 81%) and 331 at the end of July (down 8%); New Listings in August were down 38% compared to July 2024, down 11% compared to August 2023, down 1% compared to August 2022, down 12% compared to August 2021, down 40% compared to August 2020, and down 12% compared to August 2019. Month’s supply of total residential listings is steady at 5 month’s supply (balanced market conditions) and sales to listings ratio of 55% compared to 40% in July 2024, 60% in August 2023, and 76% in August 2022.

Month-over-month, the house price index is down 0.1% and in the last 6 months up 1.4%. 

Pitt Meadows: Total Units Sold in August were 21 – down from 27 (23%) in July, down from 28 (25%) in June, down from 23 (9%) in August 2023, up from 17 (24%) in August 2022, down from 24 (12%) in August 2021, down from 42 (50%) in August 2020, and down from 39 (46%) in August 2019; Active Listings were at 105 at month end compared to 78 at that time last year (up 34%) and 108 at the end of July (down 3%); New Listings in August were down 44% compared to July 2024, up 5% compared to August 2023, down 7% compared to August 2022, up 8% compared to August 2021, down 18% compared to August 2020, and up 5% compared to August 2019. Month’s supply of total residential listings is up to 5 month’s supply from 4 (balanced market conditions) and sales to listings ratio of 52% compared to 38% in July 2024, 60% in August 2023, and 39% in August 2022. 

Month-over-month, the house price index is down 0.4% and in the last 6 months up 0.1%.

Maple Ridge: Total Units Sold in August were 123 – down from 166 (26%) in July, down from 130 (5%) in June, up from 119 (3%) in August 2023, up from 113 (9%) in August 2022, down from 185 (34%) in August 2021, down from 216 (43%) in August 2020, and down from 133 (8%) in August 2019; Active Listings were at 855 at month end compared to 653 at that time last year (up 30%) and 879 at the end of July (down 3%); New Listings in August were down 19% compared to July 2024, up 1% compared to August 2023, up 18% compared to August 2022, up 26% compared to August 2021, down 9% compared to August 2020, and up 32% compared to August 2019. Month’s supply of total residential listings is up to 7 month’s supply from 5 (balanced market conditions) and sales to listings ratio of 44% compared to 48% in July 2024, 43% in August 2023, and 48% in August 2022.

Month-over-month, the house price index is down 0.6% and in the last 6 months up 0.5%. 

Ladner: Total Units Sold in August were 25 – down from 31 (19%) in July, down from 27 (11%) in June, up from 24 (4%) in August 2023, down from 27 (7%) in August 2022, down from 35 (29%) in August 2021, down from 40 (37%) in August 2020, and down from 33 (24%) in August 2019; Active Listings were at 124 at month end compared to 97 at that time last year (up 28%) and 138 at the end of July (down 10%); New Listings in August were down 15% compared to July 2024, up 36% compared to August 2023, up 36% compared to August 2022, up 29% compared to August 2021, down 35% compared to August 2020, and down 33% compared to August 2019. Month’s supply of total residential listings is up to 5 month’s supply from 4 (balanced market conditions) and sales to listings ratio of 56% compared to 58% in July 2024, 73% in August 2023, and 82% in August 2022.

Month-over-month, the house price index is up 1.0% and in the last 6 months up 3.8%. 

Tsawwassen: Total Units Sold in August were 32 – down from 45 (29%) in July, down from 44 (27%) in June, up from 28 (14%) in August 2023, up from 25 (28%) in August 2022, down from 74 (57%) in August 2021, down from 53 (40%) in August 2020, and up from 30 (7%) in August 2019; Active Listings were at 199 at month end compared to 162 at that time last year (up 23%) and 206 at the end of July (down 3%); New Listings in August were down 15% compared to July 2024, up 11% compared to August 2023, down5% compared to August 2022, down 9% compared to August 2021, down 46% compared to August 2020, and down 18% compared to August 2019. Month’s supply of total residential listings is up to 6 month’s supply from 5 (balanced market conditions) and sales to listings ratio of 53% compared to 63% in July 2024, 52% in August 2023, and 40% in August 2022.

Month-over-month, the house price index is up 0.6% and in the last 6 months up 4.1%. 

Fraser Valley: Sales in August were down 13.1%, compared to July and were down 16.2% from August 2023. New listings were down 18.6% from July and up 5.9% from August 2023.The average price was up 3.4% month-over-month and is up 7.9% year-over-year. Active listings were down 1.2% to 8,626 from 8,731 last month and up 37.1% from August 2023 which was at 6,291. Month’s supply of total residential listings is up to 8 month’s supply from 6 (buyer’s market conditions).

“Despite two policy rate cuts by the Bank of Canada, buyers are still feeling the squeeze of overall affordability challenges in B.C,” said Jeff Chadha, Chair of the Fraser Valley Real Estate Board. “With prices for single-family homes, townhouses and condos holding relatively flat year-over-year, many continue to face challenges buying their first home or moving up in the market, as reflected in seasonally slow August sales.” 

Month-over-month, the house price index is down 0.6% and in the last 6 months 0.8%. 

Read

Ok Bank of Canada: You Win!

Highlights of Dexter’s July 2024 report

  • High interest rates have slowed the economy and real estate sales

  • Active listing counts climbed again this month

  • Second highest number of new listings in July since 2008 

  • Buyer opportunities abound in the market

For the past 10 years we’ve all been asking for more listings in the real estate market… well we are finally seeing it. We have more listings, now what are we going to do it them? And as they say, opposites attract. With fewer sales and a noticeable increase in listings, the opposite of last year in the first 6 months – we could see this opposite attract more buyers to the market in the last half of 2024, attracted to the opportunities that are out there.

Let’s talk economics. The Bank of Canada made their second consecutive interest rate drop in July, seeing their rate decline to 4.5%. And with economic data abound pointing to a sluggish economy here in Canada and the U.S., expect that trend to continue through the remainder of 2024. South of the border, their Federal Bank has been more patient, and it is beginning to appear that this patience has come at a cost. Data out of the U.S. is pointing to an economy slowing quickly, resulting in a pull back in the stock market and bond yields falling quickly in both Canada and the U.S. – think fixed rate mortgages. After hitting a high of 4.46% in 2023 the 5-year Canada bond rate is down to 2.9%. The U.S. Federal Bank announcement is in September and expect their first rate cut to happen with successive rate cuts to follow that. Will that make a difference to buyer sentiment? With the increase in listing inventory allowing for more opportunity, prices are showing signs of weakness which could create one of the best buying opportunities we’ve seen in many years in Metro Vancouver. The second half of 2024 should be one of those years where the number of sales in the back half are more than the first.  

There were 2,333 properties sold in Greater Vancouver in July, after seeing 2,418 sold in June, 2,733 sold in May, 2,831 sold in April and 2,415 properties sold in March this year. There hasn’t been much variance in buyer activity in 2024, consistently patient would be the best way to describe it. This was a 5% decrease from the 2,455 properties sold last year in July after a 19% decrease in June from the 2,988 properties sold in June 2023. Comparing to last year isn’t exactly comparing apples to apples. Last spring there was a feeling that rate cuts were on the horizon and much like Lucy pulling out the football on Charlie Brown, the Bank of Canada cranked up rates in June and July. After that the market went quiet, buyers were noticeably absent. This spring, it felt more like buyer sentiment was “fool me once, shame on you, fool me twice, shame on me.” Buyers weren’t ready to fall for the story line of more interest rate cuts. But the neon sign is flashing that they are coming, and more likely faster than anticipated. 

Sales in July were 18% below the 10-year average after June was 24% below the 10-year average and May being 20% below the 10-year average. Not much changed on that front, this is a market where demand is building and waiting for the signal to buy. Trends are like 2019 where an influx of listings in the spring lead to stronger sales in the last half of the year. And after experiencing mortgage shock of the stress test in 2018 which negatively impacted the borrowing power of buyers, the demand that built up through 2018 and into 2019 started to come back into the real estate market.  

While the number of new listings dropped in July compared to August, the absorption rate remained relatively flat. Dropping slightly to 41% in July, after being at 42% the previous two months, the growth in active listings was slower. Likely due to several listings coming off the market as the patience of some sellers gave out. Greater Vancouver is still sitting at 6 months of inventory (on the border of balanced to buyer’s market). North Vancouver, New Westminster, Port Moody, Ladner and Pitt Meadows are the only cities at 4 months supply – technically a seller’s market. This is mainly due to falling total inventory counts in those areas while other cities saw total actives continue to increase in July. West Vancouver continues to be one of the only markets in Greater Vancouver showing to be a buyer’s market with its current sales activity and listing inventory. Make no mistake though, there are some areas and types of properties that are a buyer’s market.

Once again new listing totals declined in Greater Vancouver in July. After seeing 7,229 in April, 6,484 new listings in May, 5,851 new listings in June, the total for July was 5,689. It seems markets throughout North America experience this trend with more listings hitting the market, so Metro Vancouver was not alone. It helps to create a healthier balance in the market and while other locations are experiencing steeper price declines, Metro Vancouver is remaining relatively flat, with the House Price Index only down 0.8% month-over-month in Greater Vancouver. Whistler, Squamish and the Sunshine Coast are experiencing higher price declines, down 2%, 1.9% and 3.7% month-over-month respectively and down 7.7%, 3.3% and 2.8% respectively in the last year. 

For the fourth straight month, the number of new listings declined month-over-month, but July still produced more than last year. In July 2023 there were 4,757 new listings, 16% fewer than July of this year. So far 2024 has proven to show that pent up supply is finally coming to the market. After the end of July, the total number of new listings for the year is 76% of the total that came out in 2023. Expect to see fewer new listings come to the market in the last half of the year though, as it typically the case and likely more sellers playing the wait and see game. 

The number of new listings in July were 12% above the 10-year average after seeing June at 2% above the 10-year average, May at 7% above the 10-year average and April at 29% above the 10-year average. In fact, the month of July saw the second highest number of new listings for the month since 2008. While trending lower, sellers are still far more active in the real estate market than buyers. 

There were 14,326 active listings in Greater Vancouver at month end, compared to 14,180 at the end of June and 13,600 at the end of May. The growth of active listings has slowed significantly after being up 46% year-over-year at the end of May, currently sitting 39% higher than this time last year. Some sellers are simply refusing to participate in the market and taking their homes off the market after failing to attract a buyer at a price they are prepared to sell for. Some sellers are content to be on the market, while others would prefer to be sold. While not quite at the highs of 2019 when there were close to 16,000 active listings in May that year, this increase in listings is positive for the real estate market and should help to keep prices relatively flat if further interest rate decreases pull buyers back into the market. 

Looking at the different types of homes, detached active listings are up 30% year-over-year, while townhouses are up 49% and condos are up 47%. Since the end of March though, detached active listings are up 41%, while townhouses are up 38% and condos are up 32%. With new home starts down significantly and rental projects being the focus of many developers, we’ll continue to see supply constraints in the strata ownership market in the years to come. This could be the best time to get into that market. 

The detached market overall in Greater Vancouver remains at 8 months supply while townhomes and condos stayed with 5 months supply keeping it in that mix of seller’s to balanced market conditions in Greater Vancouver. The tighter supply continues to be in North Vancouver where there are only 3 months supply of townhomes and condos, Richmond, Ladner, Tsawwassen, Pitt Meadows and Maple Ridge townhomes at 3 months supply and townhomes in Port Moody with only 2 months supply. 

The autumn real estate market is setting up for one of interest rate declines and an economy in need of stimulation. The cracks are showing, have federal banks waited too long? It is beginning to appear that the 3 remaining Bank of Canada meetings could all lead to reductions in their interest rate with fixed rates following. Great news for buyers and many sellers who have been looking to sell this year.

Here’s a summary of the numbers:

Greater Vancouver: Total Units Sold in July were 2,333 – down from 2,418 (4%) in June, down from 2,733 (15%) in May, down from 2,455 (5%) in July 2023, up from 1,904 (23%) in July 2022, down from 3,375 (31%) in July 2021, down from 3,202 (27%) in July 2020, and down from 2,584 (10%) in July 2019; Active Listings were at 14,326 at month end compared to 10,301 at that time last year (up 39%) and 14,180 at the end of June (up 1%); New Listings in July were down 2% compared to June 2024, up 20% compared to July 2023, up 40% compared to July 2022, up 26% compared to July 2021, down 7% compared to July 2020, and up 20% compared to July 2019. Month’s supply of total residential listings is steady at 6 month’s supply (balanced market conditions) and sales to listings ratio of 41% compared to 42% in June 2024, 52% in July 2023, and 47% in July 2022. 

Month-over-month, the house price index is down 0.8% and in the last 6 months up 2.6%.

Vancouver Westside: Total Units Sold in July were 416 – down from 470 (11%) in June, down from 501 (17%) in May, down from 438 (5%) in July 2023, up from 368 (13%) in July 2022, down from 570 (27%) in July 2021, down from 472 (12%) in July 2020, and down from 489 (15%) in July 2019; Active Listings were at 3,040 at month end compared to 2,366 at that time last year (up 28%) and 3,069 at the end of June (down 1%); New Listings in July were down 3% compared to June 2024, up 11% compared to July 2023, up 37% compared to July 2022, up 25% compared to July 2021, 11% compared to July 2020, and up 28% compared to July 2019. Month’s supply of total residential listings is steady at 7 month’s supply (balanced market conditions) and sales to listings ratio of 37% compared to 40% in June 2024, 43% in July 2023, and 44% in July 2022.

Month-over-month, the house price index is down 0.9% and in the last 6 months up 3.1%. 

Vancouver East Side: Total Units Sold in July were 263 – down from 270 (3%) in June, down from 329 (20%) in May, down from 286 (8%) in July 2023, up from 198 (33%) in July 2022, down from 360 (27%) in July 2021, up from 344 (8%) in July 2020, and down from 277 (5%) in July 2019; Active Listings were at 1,468 at month end compared to 1,082 at that time last year (up 36%) and 1,491 at the end of June (up 2%); New Listings in July were down 8% compared to June 2024, up 18% compared to July 2023, up 36% compared to July 2022, up 22% compared to July 2021, down 14% compared to July 2020, and up 26% compared to July 2019. Month’s supply of total residential listings is steady at 6 month’s supply (balanced market conditions) and sales to listings ratio of 44% compared to 42% in June 2024, 57% in July 2023, and 45% in July 2022.

Month-over-month, the house price index is down 1.2% and in the last 6 months up 2.8%. 

North Vancouver: Total Units Sold in July were 201 – down from 221 (9%) in June, down from 245 (18%) in May, up from 185 (9%) in July 2023, up from 173 (16%) in July 2022, down from 252 (20%) in July 2021, down from 267 (25%) in July 2020, and down from 205 (2%) in July 2019; Active Listings were at 740 at month end compared to 530 at that time last year (up 40%) and 793 at the end of June (down 7%); New Listings in July were down 7% compared to June 2024, up 37% compared to July 2023, up 42% compared to July 2022, up 42% compared to July 2021, down 14% compared to July 2020, and up 16% compared to July 2019. Month’s supply of total residential listings is steady at 4 month’s supply (seller’s market conditions) and sales to listings ratio of 47% compared to 48% in June 2024, 59% in July 2023, and 57% in July 2022.

Month-over-month, the house price index is down 1.0% and in the last 6 months up 3.3%. 

West Vancouver: Total Units Sold in July were 59 – down from 75 (21%) in June, down from 67 (12%) in May, up from 47 (26%) in July 2023, up from 47 (26%) in July 2022, down from 83 (29%) in July 2021, down from 68 (13%) in July 2020, and the same as July 2019; Active Listings were at 733 at month end compared to 603 at that time last year (up 22%) and 716 at the end of June (up 2%); New Listings in July were the same as June 2024, up 16% compared to July 2023, up 45% compared to July 2022, up 36% compared to July 2021, up 9% compared to July 2020, and up 41% compared to July 2019. Month’s supply of total residential listings is up to 12 month’s supply (buyer’s market conditions) and sales to listings ratio of 27% compared to 35% in June 2024, 25% in July 2023, and 35% in July 2022.

Month-over-month, the house price index is down 1.2% but in the last 6 months up 3.3%. 

Richmond: Total Units Sold in July were 255 – down from 263 (3%) in June, down from 299 (15%) in May, down from 294 (13%) in July 2023, up from 223 (14%) in July 2022, down from 429 (41%) in July 2021, down from 363 (30%) in July 2020, and down from 301 (15%) in July 2019; Active Listings were at 1,563 at month end compared to 1,185 at that time last year (up 32%) and 1,482 at the end of June (up 5%); New Listings in July were up 12% compared to June 2024, up 18% compared to July 2023, up 47% compared to July 2022, up 4% compared to July 2021, up 2% compared to July 2020, and up 3% compared to July 2019. Month’s supply of total residential listings is steady at 6 month’s supply (balanced market conditions) and sales to listings ratio of 40% compared to 46% in June 2024, 54% in July 2023, and 52% in July 2022.

Month-over-month, the house price index is down 0.7% and in the last 6 months up 1.0%. 

Burnaby East: Total Units Sold in July were 33 – up from 17 (94%) in June, up from 31 (6%) in May, up from 25 (32%) in July 2023, up from 22 (50%) in July 2022, down from 46 (28%) in July 2021, up from 32 (3%) in July 2020, and up from 14 (136%) in July 2019; Active Listings were at 160 at month end compared to 88 at that time last year (up 82%) and 163 at the end of June (down 2%); New Listings in July were down 22% compared to June 2024, up 62% compared to July 2023, up 91% compared to July 2022, up 11% compared to July 2021, down 7% compared to July 2020, and up 40% compared to July 2019. Month’s supply of total residential listings is down to 5 month’s supply from 10 (balanced market conditions) and sales to listings ratio of 52% compared to 21% in June 2024, 64% in July 2023, and 67% in July 2022.

Month-over-month, the house price index is down 0.9% and in the last 6 months up 4.1%. 

Burnaby North: Total Units Sold in July were 137 – down from 172 (20%) in June, down from 166 (17%) in May, down from 160 (14%) in July 2023, up from 124 (10%) in July 2022, down from 197 (30%) in July 2021, down from 141 (3%) in July 2020, and up from 132 (4%) in July 2019; Active Listings were at 837 at month end compared to 481 at that time last year (up 74%) and 761 at the end of June (up 10%); New Listings in July were up 6% compared to June 2024, up 36% compared to July 2023, up 63% compared to July 2022, up 46% compared to July 2021, up 44% compared to July 2020, and up 69% compared to July 2019. Month’s supply of total residential listings is up to 6 month’s supply from 4 (balanced market conditions) and sales to listings ratio of 35% compared to 46% in June 2024, 55% in July 2023, and 51% in July 2022.

Month-over-month, the house price index is down 0.4% and in the last 6 months up 2.3%. 

Burnaby South: Total Units Sold in July were 140 – up from 135 (4%) in June, up from 127 (10%) in May, up from 139 (1%) in July 2023, up from 126 (11%) in July 2022, down from 202 (31%) in July 2021, up from 114 (23%) in July 2020, and down from 152 (8%) in July 2019; Active Listings were at 682 at month end compared to 457 at that time last year (up 49%) and 699 at the end of June (down 2%); New Listings in July were down 14% compared to June 2024, up 17% compared to July 2023, up 36% compared to July 2022, up 3% compared to July 2021, down 11% compared to July 2020, and up 17% compared to July 2019. Month’s supply of total residential listings is steady at 5 month’s supply (balanced market conditions) and sales to listings ratio of 50% compared to 42% in June 2024, 59% in July 2023, and 61% in July 2022.

Month-over-month, the house price index is down 0.5% and in the last 6 months up 1.5%. 

New Westminster: Total Units Sold in July were 98 – down from 108 (9%) in June, down from 115 (15%) in May, down from 119 (18%) in July 2023, up from 82 (20%) in July 2022, down from 163 (40%) in July 2021, down from 164 (40%) in July 2020, and down from 122 (20%) in July 2019; Active Listings were at 428 at month end compared to 304 at that time last year (up 41%) and 433 at the end of June (down 1%); New Listings in July were down 3% compared to June 2024, up 13% compared to July 2023, up 41% compared to July 2022, up 4% compared to July 2021, down 25% compared to July 2020, and up 5% compared to July 2019. Month’s supply of total residential listings is steady at 4 month’s supply (seller’s market conditions) and sales to listings ratio of 47% compared to 50% in June 2024, 64% in July 2023, and 55% in July 2022.

Month-over-month, the house price index is down 0.5% and in the last 6 months up 1.5%. 

Coquitlam: Total Units Sold in July were 178 – down from 179 (1%) in June, down from 228 (22%) in May, down from 223 (20%) in July 2023, up from 142 (25%) in July 2022, down from 292 (39%) in July 2021, down from 287 (38%) in July 2020, and down from 236 (25%) in July 2019; Active Listings were at 1,047 at month end compared to 636 at that time last year (up 65%) and 961 at the end of June (up 9%); New Listings in July were up 10% compared to June 2024, up 23% compared to July 2023, up 77% compared to July 2022, up 47% compared to July 2021, up 17% compared to July 2020, and up 15% compared to July 2019. Month’s supply of total residential listings is up to 6 month’s supply from 5 (balanced market conditions) and sales to listings ratio of 35% compared to 42% in June 2024, 55% in July 2023, and 50% in July 2022.  

Month-over-month, the house price index is down 0.3% and in the last 6 months up 1.2%. 

Port Moody: Total Units Sold in July were 58 – up from 56 (4%) in June, the same as May, down from 85 (32%) in July 2023, up from 45 (29%) in July 2022, down from 93 (38%) in July 2021, down from 96 (40%) in July 2020, and up from 56 (4%) in July 2019; Active Listings were at 238 at month end compared to 186 at that time last year (up 28%) and 241 at the end of June (down 1%); New Listings in July were down 16% compared to June 2024, up 1% compared to July 2023, up 35% compared to July 2022, up 35% compared to July 2021, down 2% compared to July 2020, and up 49% compared to July 2019. Month’s supply of total residential listings is steady at 4 month’s supply (seller’s market conditions) and sales to listings ratio of 52% compared to 42% in June 2024, 77% in July 2023, and 54% in July 2022.

Month-over-month, the house price index is down 0.3% and in the last 6 months up 4.5%. 

Port Coquitlam: Total Units Sold in July were 66 – up from 62 (6%) in June, down from 95 (31%) in May, down from 73 (10%) in July 2023, down from 71 (7%) in July 2022, down from 103 (36%) in July 2021, down from 119 (45%) in July 2020, and down from 86 (23%) in July 2019; Active Listings were at 331 at month end compared to 172 at that time last year (up 92%) and 313 at the end of June (up 6%); New Listings in July were down 5% compared to June 2024, up 34% compared to July 2023, up 20% compared to July 2022, up 50% compared to July 2021, down 4% compared to July 2020, and up 8% compared to July 2019. Month’s supply of total residential listings is steady at 5 month’s supply (balanced market conditions) and sales to listings ratio of 40% compared to 36% in June 2024, 60% in July 2023, and 52% in July 2022.

Month-over-month, the house price index is down 0% and in the last 6 months up 3.3%. 

Pitt Meadows: Total Units Sold in July were 27 – down from 28 (4%) in June, down from 30 (10%) in May, up from 24 (13%) in July 2023, up from 22 (23%) in July 2022, down from 39 (31%) in July 2021, down from 48 (44%) in July 2020, and up from 20 (35%) in July 2019; Active Listings were at 108 at month end compared to 74 at that time last year (up 45%) and 97 at the end of June (up 11%); New Listings in July were up 31% compared to June 2024, up 54% compared to July 2023, up 48% compared to July 2022, up 97% compared to July 2021, up 15% compared to July 2020, and up 42% compared to July 2019. Month’s supply of total residential listings is steady up to 4 month’s supply from 3 (seller’s market conditions) and sales to listings ratio of 38% compared to 51% in June 2024, 52% in July 2023, and 45% in July 2022.  

Month-over-month, the house price index is down 0% and in the last 6 months up 3.4%.

Maple Ridge: Total Units Sold in July were 166 – up from 130 (28%) in June, down from 172 (3%) in May, up from 143 (16%) in July 2023, up from 108 (54%) in July 2022, down from 188 (12%) in July 2021, down from 246 (33%) in July 2020, and down from 182 (10%) in July 2019; Active Listings were at 879 at month end compared to 622 at that time last year (up 41%) and 889 at the end of June (down 1%); New Listings in July were down 4% compared to June 2024, up 19% compared to July 2023, up 22% compared to July 2022, up 44% compared to July 2021, down 7% compared to July 2020, and up 6% compared to July 2019. Month’s supply of total residential listings is down to 5 month’s supply from 7 (balanced market conditions) and sales to listings ratio of 48% compared to 36% in June 2024, 50% in July 2023, and 38% in July 2022.

Month-over-month, the house price index is down 0.3% and in the last 6 months up 3.3%. 

Ladner: Total Units Sold in July were 31 – up from 27 (15%) in June, down from 33 (6%) in May, up from 26 (19%) in July 2023, up from 13 (138%) in July 2022, down from 39 (21%) in July 2021, down from 49 (37%) in July 2020, and down from 34 (9%) in July 2019; Active Listings were at 138 at month end compared to 102 at that time last year (up 35%) and 140 at the end of June (down 1%); New Listings in July were down 12% compared to June 2024, down 9% compared to July 2023, up 29% compared to July 2022, up 66% compared to July 2021, down 26% compared to July 2020, and down 10% compared to July 2019. Month’s supply of total residential listings is down to 4 month’s supply from 5 (seller’s market conditions) and sales to listings ratio of 58% compared to 45% in June 2024, 45% in July 2023, and 32% in July 2022.

Month-over-month, the house price index is down 0.4% and in the last 6 months up 2.5%. 

Tsawwassen: Total Units Sold in July were 45 – up from 44 (2%) in June, up from 40 (13%) in May, up from 33 (36%) in July 2023, up from 28 (61%) in July 2022, down from 58 (22%) in July 2021, down from 62 (27%) in July 2020, and down from 46 (2%) in July 2019; Active Listings were at 206 at month end compared to 161 at that time last year (up 28%) and 224 at the end of June (down 8%); New Listings in July were down 15% compared to June 2024, up 11% compared to July 2023, up 27% compared to July 2022, up 9% compared to July 2021, down 45% compared to July 2020, and the same as July 2019. Month’s supply of total residential listings is steady at 5 month’s supply (balanced market conditions) and sales to listings ratio of 63% compared to 52% in June 2024, 52% in July 2023, and 50% in July 2022.

Month-over-month, the house price index is up 1.2% and in the last 6 months up 3.2%. 

Fraser Valley: Sales in July were down 6.6%, compared to June and were down 10.1% from July 2023. New listings were down 0.2% from June and up 19.5% from July 2023.The average price was up 0.4% month-over-month and is up 0.8% year-over-year. Active listings were up 4.6% to 8,731 from 8,350 last month and up 40.8% from July 2023 which was at 6,199. Month’s supply of total residential listings is up to 6 month’s supply (balanced to buyer’s market conditions).

“Amidst an overall balanced market, some REALTORS® are experiencing pockets within the Fraser Valley that favour buyers, where prices have come down,” said Jeff Chadha, Chair of the Fraser Valley Real Estate Board. “This is evident in the amount of time buyers have to view a property before considering making an offer. Properties that are well-priced are selling quickly, suggesting motivated buyers are active in the market despite the slowdown.” 

Month-over-month, the house price index is down 0.5% and in the last 6 months up 0.1%. 

Read

The Consistently Inconsistent Real Estate Market!

Highlights of Dexter’s June 2024 report

  • Will July bring the next Bank of Canada Interest rate cut?

  • Growth of listings slowed in June

  • Buyer activity waned in June  

  • Is it really a balanced market?

  • Expect to see 15 to 20% less new listings in the fall 

With a dash of uncertainty, a promise of more interest rate cuts yet to come and buyer hesitancy a main ingredient, June saw a real estate market with fewer sales and fewer new listings. Activity levels were less than ideal in June, and after a slower start to 2024 it’s not as if everyone needs a break. But that could lead to a more active fall market, like 2019 when the first half of the year produced less sales than the second half of the year, a consistent recovery leading up to the early part of 2020. And interest rates will be coming down, and even if it’s not as quick as we anticipated or as impactful in terms of affordability, it will still provide for a boost for some buyers who’ve been playing the waiting game.

There were 2,418 properties sold in Greater Vancouver in June, after seeing 2,733 sold in May, 2,831 sold in April and 2,415 properties sold in March this year. This was a 19% decrease from the 2,988 properties sold last year in June after a 20% decrease in May from the 3,411 properties sold in May 2023. For the second consecutive month, sales dropped month over month in the region. As new listings remained elevated in June, active listings continued to rise – albeit at a slower pace than the last two months prior to June. Hitting 3,000 sales in a month in Greater Vancouver remains elusive with that level being achieved only once in the last 26 months. The last time this happened was 2012/2013 and 2018/2019. Buyer demand continues to build up and that will eventually unleash into the market. We could see that happen at the beginning of this fall as interest rates continue to decline. 

Sales in June were 24% below the 10-year average after being 20% below the 10-year average in May, 12% below the 10-year-average in April and 30% below the 10-year average in March. Consistently inconsistent is the theme of the current real estate market. Not just month by month but area by area. Some regions/product types are showing significant increases in listings while others are struggling to keep up with buyer demand. Sales in the first half of 2024 totaled 13,894 in Greater Vancouver, which was below the 14,529 in the first half of 2023 although higher than the 10,992 in the first half of 2019. If this market continues like 2019, we can expect to see a much busier fall. In fact, sales in July and August 2019 were higher than June that year. It’s not impossible to think that buyers are starting to take notice of the increase in listings and opportunities in the market. 

With the increase in new listings and overall absorption remaining at 42%, the months of supply in Greater Vancouver moved up again, now at 6 months (on the border of balanced to buyer’s market). North Vancouver, Burnaby North, New Westminster and Port Moody are the only cities at 4 months supply now while Pitt Meadows remains at 3 months. These areas while technically in seller’s market conditions are showing signs of shifting closer to a balanced market. The number of detached sales in Port Moody dropped down to 6 in June, from 16 in May.  

New listing totals declined in Greater Vancouver; much like the number of sales. After seeing 7,229 in April, and 6,484 new listings in May, the total for June dropped down to 5,821. Much like the cool spring weather, maybe some heat in the summer will warm up the market for buyers after sellers ignited the listing counts. 

While the number of new listings in June were less than May, they were still higher than the total of 5,468 that came out in June 2023 and the 5,410 that came out in June 2022. Total new listings were slightly below the totals of June 2021 which saw 5,981 come on the market in a year with significantly more sales.  Pent-up supply continues to feed the new listings surge we’ve seen, and much like the inconsistencies of the real estate market, where and what types of homes come on the market vary. And the increase in new listings has really come in the last 3 months. Year-over-year, active listings are up 41% in Greater Vancouver, with the increase in the last 3 months alone at 35%. What exactly is driving the increase in listings is difficult to pinpoint and is likely a collection of triggers. Be it capital gains changes, tenancy regulation changes, short term rental changes, or elevated interest rates, all are likely motivating owners to list their homes. Not to mention typical moves that have seemingly been on hold over the last two years.

The number of new listings in June were 2% above the 10-year average after May was 7% above the 10-year average and April was 29% above the 10-year average. Not a surprise to see the number of new listings decline in June as sellers prepare for the end of the school year and look to summer holidays and fun. But in comparison to what we’ve seen in the two months prior, June showed less sellers engaging. Could this be the peak of listing activity for 2024? With the spring market typically being the most active time to list, we aren’t likely to see the number of new listings at the same levels in the fall market. Expect to see new listing amounts 20% to 25% less in the fall. 

There were 14,180 active listings in Greater Vancouver at month end, compared to 13,600 at the end of May and 12,491 at the end of April. Compared to this time last year, listings are up 41% from the 9,990 at the end of June 2023 – after being up 46% year-over-year at the end of May. This is the highest number of active listings since the fall of 2019, although not at the levels seen in 2012 when there were nearly 20,000 active listings on the market. Detached active listings are up 30% year-over-year, while townhouses are up 52% and condos are up 53%. Since the end of March though, detached active listings are up 39%, while townhouses are up 37% and condos are up 31%. Are detached homeowners feeling the pinch of higher interest rates? Perhaps not in West Vancouver where detached sales jumped to 43 from 34 in May. 

The detached market overall in Greater Vancouver jumped up to 8 months supply from 6 - a buyer’s market. Townhomes and condos moved up to 5 months supply from 4 – shifting both to balanced market conditions in Greater Vancouver. There is a wide variance of supply in the market with some areas like North Vancouver sitting with 3 months supply in condos and townhomes and 4 months supply in detached homes, while Vancouver has 8 months supply of detached homes available. 

Overall, the trend is a balanced market, how long that remains is what we’ll see through the rest of 2024. Interest rates and economic conditions will feed into the mindset of buyers and provide signals on when to purchase. Those that take advantage before everyone else could find themselves with the best buying opportunity this decade. While prices will fluctuate with supply and demand changes in the market, overall downward pressure on prices could be limited. And for those areas where listing inventory is still low, prices may be firm and be subject to buyer competition. 

Here’s a summary of the numbers:

Greater Vancouver: Total Units Sold in June were 2,418 - down from 2,733 (12%) in May, down from 2,831 (15%) in April, up from 2,415 (0.1%) in March, down from 2,988 (19%) in June 2023, down from 2,466 (2%) in June 2022, down from 3,824 (37%) in June 2021, down from 2,497 (3%) in June 2020, and up from 2,098 (15%) in June 2019; Active Listings were at 14,180 at month end compared to 9,990 at that time last year (up 42%) and 13,600 at the end of May (up 4%); New Listings in June were down 10% compared to May 2024, up 6% compared to June 2023, up 8% compared to June 2022, down 3% compared to June 2021, down 2% compared to June 2020, and up 20% compared to June 2019. Month’s supply of total residential listings is up to 6 month’s supply from 5 (balanced market conditions) and sales to listings ratio of 42% compared to 42% in May 2024, 55% in June 2023, and 46% in June 2022. 

Month-over-month, the house price index is down 0.4% and in the last 6 months up 3.5%.

Vancouver Westside: Total Units Sold in June were 470 - down from 501 (6%) in May, down from 471 (0.3%) in April, up from 424 (11%) in March, down from 527 (11%) in June 2023, up from 448 (5%) in June 2022, down from 616 (24%) in June 2021, up from 409 (15%) in June 2020, and up from 355 (32%) in June 2019; Active Listings were at 3,069 at month end compared to 2,249 at that time last year (up 36%) and 2,962 at the end of May (up 4%); New Listings in June were down 11% compared to May 2024, up 7% compared to June 2023, up 9% compared to June 2022, down 9% compared to June 2021, up 1% compared to June 2020, and up 32% compared to June 2019. Month’s supply of total residential listings is up to 7 month’s supply from 6 (balanced market conditions) and sales to listings ratio of 40% compared to 38% in May 2024, 48% in June 2023, and 42% in June 2022.

Month-over-month, the house price index is up 0.5% and in the last 6 months up 4.7%. 

Vancouver East Side: Total Units Sold in June were 270 - down from 329 (18%) in May, down from 349 (23%) in April, down from 285 (5%) in March, down from 325 (17%) in June 2023, up from 265 (2%) in June 2022, down from 451 (40%) in June 2021, down from 280 (4%) in June 2020, and up from 215 (26%) in June 2019; Active Listings were at 1,491 at month end compared to 1,082 at that time last year (up 38%) and 1,459 at the end of May (up 2%); New Listings in June were down 11% compared to May 2024, up 4% compared to June 2023, up 12% compared to June 2022, down 6% compared to June 2021, down 1% compared to June 2020, and up 33% compared to June 2019. Month’s supply of total residential listings is up to 6 month’s supply from 4 (from a seller’s market to a balanced market conditions) and sales to listings ratio of 42% compared to 45% in May 2024, 52% in June 2023, and 46% in June 2022.

Month-over-month, the house price index is up 0.4% and in the last 6 months up 3.6%. 

North Vancouver: Total Units Sold in June were 221 - down from 245 (10%) in May, down from 248 (11%) in April, up from 187 (18%) in March, down from 247 (11%) in June 2023, up from 199 (11%) in June 2022, down from 322 (31%) in June 2021, down from 239 (8%) in June 2020, and up from 202 (9%) in June 2019; Active Listings were at 793 at month end compared to 553 at that time last year (up 43%) and 796 at the end of May (up 0.4%); New Listings in June were down 14% compared to May 2024, up 15% compared to June 2023, up 2% compared to June 2022, down 1% compared to June 2021, down 14% compared to June 2020, and up 10% compared to June 2019. Month’s supply of total residential listings is up to 4 month’s supply from 3 (seller’s market conditions) and sales to listings ratio of 48% compared to 46% in May 2024, 62% in June 2023, and 43% in June 2022.

Month-over-month, the house price index is up 0.2% and in the last 6 months up 3.6%. 

West Vancouver: Total Units Sold in June were 75 (the highest in over a year) - up from 67 (12%) in May, up from 70 (7%) in April, up from 53 (42%) in March, up from 56 (34%) in June 2023, down from 60 (25%) in June 2022, down from 89 (16%) in June 2021, up from 62 (21%) in June 2020, and up from 43 (74%) in June 2019; Active Listings were at 716 at month end compared to 578 at that time last year (up 42%) and 696 at the end of May (up 4%); New Listings in June were down 17% compared to May 2024, down 0.5% compared to June 2023, up 6% compared to June 2022, up 2% compared to June 2021, down 3% compared to June 2020, and up 19% compared to June 2019. Month’s supply of total residential listings is steady at 10 months (buyer’s market conditions) and sales to listings ratio of 35% compared to 26% in May 2024, 26% in June 2023, and 30% in June 2022.

Month-over-month, the house price index is down 0.3% but in the last 6 months up 4.8%. 

Richmond: Total Units Sold in June were 263 - down from 299 (12%) in May, down from 336 (22%) in April, down from 279 (3%) in March, down from 362 (27%) in June 2023, down from 337 (22%) in June 2022, down from 472 (46%) in June 2021, down from 272 (3%) in June 2020, and down from 270 (3%) in June 2019; Active Listings were at 1,482 at month end compared to 1,143 at that time last year (up 3%) and 1,440 at the end of May (up 4%); New Listings in June were down 13% compared to May 2024, down 11% compared to June 2023, down 9% compared to June 2022, down 21% compared to June 2021, down 11% compared to June 2020, and down 10% compared to June 2019. Month’s supply of total residential listings is up to 6 month’s supply from 5 (balanced market conditions) and sales to listings ratio of 46% compared to 46% in May 2024, 57% in June 2023, and 54% in June 2022.

Month-over-month, the house price index is down 1.5% and in the last 6 months up 2.4%. 

Burnaby East: Total Units Sold in June were 17 - down from 31 (45%) in May, down from 30 (43%) in April, up from 32 (47%) in March, down from 47 (64%) in June 2023, down from 25 (32%) in June 2022, down from 49 (65%) in June 2021, down from 21 (19%) in June 2020, and down from 19 (11%) in June 2019; Active Listings were at 163 at month end compared to 94 at that time last year (up 73%) and 117 at the end of May (up 39%); New Listings in June were up 33% compared to May 2024, up 27% compared to June 2023, up 103% compared to June 2022, up 47% compared to June 2021, up 40% compared to June 2020, and up 62% compared to June 2019. Month’s supply of total residential listings is up to 10 month’s supply from 4 (buyer’s market conditions) and sales to listings ratio of 21% compared to 51% in May 2024, 73% in June 2023, and 63% in June 2022.

Month-over-month, the house price index is down 0.9% and in the last 6 months up 3.8%. 

Burnaby North: Total Units Sold in June were 172 - up from 166 (4%) in May, up from 162 (6%) in April, up from 109 (58%) in March, up from 170 (1%) in June 2023, up from 138 (25%) in June 2022, down from 215 (20%) in June 2021, up from 107 (61%) in June 2020, and up from 100 (72%) in June 2019; Active Listings were at 761 at month end compared to 440 at that time last year (up 73%) and 749 at the end of May (up 2%); New Listings in June were down 4% compared to May 2024, up 40% compared to June 2023, up 42% compared to June 2022, up 22% compared to June 2021, up 36% compared to June 2020, and up 62% compared to June 2019. Month’s supply of total residential listings is down to 4 month’s supply from 5 (seller’s market conditions) and sales to listings ratio of 46% compared to 42% in May 2024, 63% in June 2023, and 52% in June 2022.

Month-over-month, the house price index is up 0.2% and in the last 6 months up 2.6%. 

Burnaby South: Total Units Sold in June were 135 - up from 127 (6%) in May, down from 143 (6%) in April, down from 142 (5%) in March, down from 174 (22%) in June 2023, down from 144 (6%) in June 2022, down from 217 (38%) in June 2021, up from 93 (45%) in June 2020, and up from 121 (12%) in June 2019; Active Listings were at  at 699 end compared to 449 at that time last year (up 56%) and 645 at the end of May (up 8%); New Listings in June were down 6% compared to May 2024, up 14% compared to June 2023, up 16% compared to June 2022, down 8% compared to June 2021, up 13% compared to June 2020, and up 22% compared to June 2019. Month’s supply of total residential listings is steady at 5 month’s supply (balanced market conditions) and sales to listings ratio of 42% compared to 37% in May 2024, 61% in June 2023, and 51% in June 2022. 

Month-over-month, the house price index is down 0.9% and in the last 6 months up 2.2%. 

New Westminster: Total Units Sold in June were 108 - down from 115 (6%) in May, up from 105 (3%) in April, the same as 108 in March, down from 119 (9%) in June 2023, down from 111 (3%) in June 2022, down from 154 (30%) in June 2021, up from 97 (11%) in June 2020, and up from 97 (11%) in June 2019; Active Listings were at 433 at month end compared to 294 at that time last year (up 47%) and 428 at the end of May (up 1%); New Listings in June were the same as May 2024, up 16% compared to June 2023, up 16% compared to June 2022, down 15% compared to June 2021, down 18% compared to June 2020, and up 6% compared to June 2019. Month’s supply of total residential listings is steady at 5 month’s supply (seller’s market conditions) and sales to listings ratio of 50% compared to 53% in May 2024, 64% in June 2023, and 60% in June 2022. 

Month-over-month, the house price index is down 1.9% and in the last 6 months up 2.0%. 

Coquitlam: Total Units Sold in June were 189 - down from 228 (17%) in May, down from 238 (21%) in April, down from 235 (20%) in March, down from 267 (29%) in June 2023, the same as June 2022, down from 329 (43%) in June 2021, down from 216 (12%) in June 2020, and up from 177 (7%) in June 2019; Active Listings were at 961 at month end compared to 590 at that time last year (up 63%) and 914 at the end of May (up 5%); New Listings in June were down 12% compared to May 2024, up 5% compared to June 2023, up 24% compared to June 2022, down 0.3% compared to June 2021, up 0.2% compared to June 2020, and up 17% compared to June 2019. Month’s supply of total residential listings is up to 5 month’s supply from 4 (balanced market conditions) and sales to listings ratio of 42% compared to 44% in May 2024, 61% in June 2023, and 51% in June 2022. 

Month-over-month, the house price index is down 1.0% and in the last 6 months up 1.8%. 

Port Moody: Total Units Sold in June were 56 - down from 58 (3%) in May, down from 73 (23%) in April, up from 45 (24%) in March, down from 97 (42%) in June 2023, down from 57 (2%) in June 2022, down from 95 (41%) in June 2021, down from 59 (5%) in June 2020, and up from 42 (33%) in June 2019; Active Listings were at 241 at month end compared to 194 at that time last year (up 24%) and 219 at the end of May (up 10%); New Listings in June were up 10% compared to May 2024, down 12% compared to June 2023, up 12% compared to June 2022, down 12% compared to June 2021, down 9% compared to June 2020, and up 52% compared to June 2019. Month’s supply of total residential listings is steady at 4 month’s supply (seller’s market conditions) and sales to listings ratio of 43% compared to 48% in May 2024, 64% in June 2023, and 48% in June 2022. 

Month-over-month, the house price index is down 0.4% and in the last 6 months up 2.5%. 

Port Coquitlam: Total Units Sold in June were 62 - down from 95 (35%) in May, down from 102 (39%) in April, down from 89 (30%) in March, down from 91 (32%) in June 2023, down from 94 (34%) in June 2022, down from 140 (56%) in June 2021, down from 91 (32%) in June 2020, and down from 77 (19%) in June 2019; Active Listings were at 313 at month end compared to 164 at that time last year (up 91%) and 278 at the end of May (up 13%); New Listings in June were down 1% compared to May 2024, up 22% compared to June 2023, up 12% compared to June 2022, up 4% compared to June 2021, up 2% compared to June 2020, and down 2% compared to June 2019. Month’s supply of total residential listings is up to 5 month’s supply from 3 (balanced market conditions) and sales to listings ratio of 36% compared to 55% in May 2024, 65% in June 2023, and 61% in June 2022. 

Month-over-month, the house price index is down 0.8% and in the last 6 months up 3.6%. 

Pitt Meadows: Total Units Sold in June were 28 - down from 30 (7%) in May, down from 30 (7%) in April, down from 29 (3%) in March, down from 36 (22%) in June 2023, up from 23 (22%) in June 2022, down from 44 (36%) in June 2021, the same as June 2020, and up from 24 (17%) in June 2019; Active Listings were at 97 at month end compared to 67 at that time last year (up 44%) and 94 at the end of May (up 3%); New Listings in June were down 25% compared to May 2024, up 20% compared to June 2023, down 5% compared to June 2022, down 10% compared to June 2021, down 0% compared to June 2020, and up 15% compared to June 2019. Month’s supply of total residential listings remains at 3 month’s supply (seller’s market conditions) and sales to listings ratio of 51% compared to 41% in May 2024, 80% in June 2023, and 40% in June 2022. 

Month-over-month, the house price index is down 1.5% and in the last 6 months up 6.1%.

Maple Ridge: Total Units Sold in June were 130 - down from 172 (24%) in May, down from 191 (32%) in April, down from 187 (30%) in March, down from 199 (35%) in June 2023, down from 135 (4%) in June 2022, down from 244 (47%) in June 2021, down from 189 (31%) in June 2020, and down from 132 (2%) in June 2019; Active Listings were at 889 at month end compared to 606 at that time last year (up 46%) and 850 at the end of May (up 5%); New Listings in June were down 12% compared to May 2024, up 0% compared to June 2023, down 12% compared to June 2022, up 29% compared to June 2021, up 7% compared to June 2020, and up 24% compared to June 2019. Month’s supply of total residential listings is up to 7 month’s supply from 5 (balanced market conditions) and sales to listings ratio of 36% compared to 42% in May 2024, 56% in June 2023, and 33% in June 2022. 

Month-over-month, the house price index is down 0.3% and in the last 6 months up 3.6%. 

Ladner: Total Units Sold in June were 27 - down from 33 (18%) in May, down from 33 (18%) in April, down from 30 (10%) in March, down from 34 (2%1) in June 2023, down from 29 (7%) in June 2022, down from 52 (48%) in June 2021, down from 38 (29%) in June 2020, and down from 33 (18%) in June 2019; Active Listings were at 140 at month end compared to 87 at that time last year (up 61%) and 139 at the end of May (up 1%); New Listings in June were down 21% compared to May 2024, up 9% compared to June 2023, up 9% compared to June 2022, down 13% compared to June 2021, down 2% compared to June 2020, and up 14% compared to June 2019. Month’s supply of total residential listings is up to 5 month’s supply from 4 (balanced market conditions) and sales to listings ratio of 45% compared to 43% in May 2024, 62% in June 2023, and 53% in June 2022. 

Month-over-month, the house price index is down 1.6% and in the last 6 months up 3.2%. 

Tsawwassen: Total Units Sold in June were 44 - up from 40 (10%) in May, down from 51 (14%) in April, up from 34 (29%) in March, up from 41 (7%) in June 2023, up from 40 (10%) in June 2022, down from 70 (37%) in June 2021, down from 48 (8%) in June 2020, and up from 35 (26%) in June 2019; Active Listings were at 224 at month end compared to 163 at that time last year (up 37%) and 218 at the end of May (up 3%); New Listings in June were down 15% compared to May 2024, up 20% compared to June 2023, up 6% compared to June 2022, down 16% compared to June 2021, down 28% compared to June 2020, and up 6% compared to June 2019. Month’s supply of total residential listings is steady at 5 month’s supply (balanced market conditions) and sales to listings ratio of 52% compared to 40% in May 2024, 59% in June 2023, and 51% in June 2022. 

Month-over-month, the house price index is down 2.8% and in the last 6 months up 2.1%. 

Fraser Valley: Sales in June were up 13.2%, compared to May and were down 31.9% from June 2023. New listings were down 9.1% from May and down 0.2% from June 2023.The average price was down 5.2% month-over-month and is down 8.3% year-over-year. Active listings were up 5.6% to 8,305 from 7,904 last month and up 40.5% from June 2023 which was at 5,944. Month’s supply of total residential listings is steady at 6 month’s supply (balanced market conditions).

“With seasonally slow sales in June and a steady increase in inventory, we’d expect to see affordability improve,” said Jeff Chadha, Chair of the Fraser Valley Real Estate Board. “However, prices in the Fraser Valley remained relatively flat. That said, despite slow sales, properties that are well-priced are finding buyers, and are subsequently selling within three to four weeks.” 

Month-over-month, the house price index is down 0.5% and in the last 6 months up 1.7%. 

Read

And the Listings Kept on Coming!

Highlights of Dexter’s May 2024 report

  • The first Bank of Canada rate cut since 2020 – now what?

  • Active listings in Greater Vancouver are up 46% from last year

  • Buyers are being patient; sales dipped in May 

  • Watch the Micro Markets closely

  • Prices are relatively flat and some are down in the last 6 months

The Canadian Economy has been speaking, and the Bank of Canada finally listened. This morning, they dropped their overnight right by a quarter point which will see rates for variable rate mortgages and lines of credit come down. While not substantial, it signals the start of downward movement with interest rates. A welcome relief to many and perhaps a signal that it’s time to buy. With the next announcement in July, many will be singing like Tim McGraw “I like it, I love it, I want some more of it.”

For the second month in a row, the story was listings. More and more listings came on the market in May, albeit off the pace of April. The result is active listing inventory is at levels not seen since later 2020 after the world opened post Covid shutdown. Buyers are more patient though, with sales overall in Greater Vancouver down from April and May of last year – although the Fraser Valley saw sales creep up from April. This only adds to the level of pent-up demand that will start to act with more favourable interest rate and economic conditions. It’s not a matter of will buyers engage, but a question of when. 

While there was a break this month in new housing regulations, the market is still factoring in the numerous changes to various housing legislation introduced at the provincial and federal levels. Likely we are seeing properties listed due to capital gains changes, short term rental restrictions and investor frustration with the regulations of their rental properties they own. Owning a property in British Columbia has become a lot more difficult and more costly and as a result some sellers would rather sell than hold. This has the knock-on effect of removing some rental stock at the same time – not ideal for those struggling to find a rental.

There were 2,733 properties sold in Greater Vancouver in May after seeing 2,831 properties sold in April and 2,415 properties sold in March this year. This was a 20% decrease from the 3,411 properties sold last year in May. This marked the first month-over-month decline in sales this year. With increased listing counts, it should have brought on more sales, but buyers are continuing to show more patience and take advantage of the opportunity of choice. 

Sales in May were 20% below the 10-year average after being 12% below the 10-year-average in April and 30% below the 10-year average in March. One step forward, one step backward seems to be the theme in the real estate market. But with the number of homes for sale increasing, this will lead to a better chance for increasing home sale when buyers engage. And that may just be this month. What seems to be happening though is that real estate activity is occurring in many different micro markets. Detached houses on Vancouver’s West Side can sell with 5 offers in the $3M range while apartment listings below $1 Million can sit.

Detached properties overall saw the lowest growth in new listings in May, while townhouses surprisingly showed the most growth in new listings. And apartment sales were down the most year-over-year, likely an indication of how much higher interest rates are impacting that end of the market. First time buyers while getting the benefit of more choice still must contend with higher rates and especially the stress test which adds another 2% onto the rate for qualification purposes. Expect to see that segment of the market move quickly with rate reductions. Looking at detached home sales, they were up 4% month-over-month while down 18% year-over-year (although Pitt Meadows and Maple Ridge saw more sales year-over-year), townhouse sales were down 20% month-over-month and down 13% year-over-year and condo sales were down 6% month-over-month and down 22% year-over-year. 

As listings increased in the last two months, the months of supply didn’t increase much if at all in some areas. Greater Vancouver ticked up to 5 months supply (on the border of balanced to seller’s market), while some areas like North Vancouver (even with the number of active townhouse listings double the amount there were in May 2023), Port Coquitlam and Pitt Meadows are at 3 months supply, while New Westminster, Coquitlam, Port Moody and Ladner are at 4 months supply. All while listings totals ramped up. 

While we didn’t hit 7,000 for the number of new listings in May, after reaching 7,229 in April in Greater Vancouver, there were still 6,484 new listings that came on. Just shy of the May 2022 at 6491 and off the May 2021 high for that month at 7,276. For a variety of reasons sellers were coming to the market over the last 2 months, after being patient over the last 2 years. As we’ve said, significant pent-up supply had been building as many moves were on hold due to higher interest rates, lack of buyer demand and an inability to find the next home. With more choice available for sellers, we are seeing the sell and buy transactions coming back into the market. That has been missing over the last few years. And with more supply, prices are holding and, in some areas, and property types seeing downward pressure. 

The number of new listings in May were 7% above the 10-year average after April was 29% above the 10-year average and March was 9% below the 10-year average. May will typically see a significant number of sellers come to the market in advance of summer, so it isn’t surprising to see those numbers. We’ll see the number of new listings decrease as June winds down and the summer months come upon us.  

There were 13,600 active listings in Greater Vancouver at month end, compared to the 12,491 actives at the end of April and 10,552 at the end of March. With sales to listings ratios around 40% over the last two months, it’s allowed active listing counts to grow quickly in the region. Compared to this time last year, listings are up 46% from the 9,293 at the end of May 2023.  Detached active listings are up 37% year-over-year, while townhouses are up 53% and condos are up 56%. The detached market overall in Greater Vancouver remains at 6 months supply - a balanced market. Vancouver’s East Side is bucking this trend though, sitting with 4 month’s supply for all residential properties and producing some interesting multiple offer sales. Townhomes moved up to 4 months supply from 3 and condos stayed at 4 months supply - keeping both technically in seller’s market conditions in Greater Vancouver. Area by area market activity and the level of competition for listings will vary. Considering how much has come on the market; we still aren’t close to a true buyer’s market and it wont’ take much to see the shift back to a seller’s market. 

The last two months have seen a shift in the real estate market to more active sellers and increased buyer hesitation. With so much talk about interest rates, it’s easy to see why buyers are playing the waiting game. With visions of lower rates, why buy now and let’s shop for the best deal has become theme in the buyer world. But tides can shift quickly, when interest rates creep down. Buyers may soon find that the competition they were trying to avoid may come back quicker than expected. Those not distracted or hampered by elevated interest rates could see the best buying opportunity in some time. 

Here’s a summary of the numbers:

Greater Vancouver: Total Units Sold in May were 2,733 – down from 2,831 (3%) in April, up from 2,415 (13%) in March, down from 3,411 (20%) in May 2023, down from 2,947 (7%) in May 2022, down from 4,346 (37%) in May 2021, up from 1,506 (81%) in May 2020, and up from 2,669 (2%) in May 2019; Active Listings were at 13,600 at month end compared to 9,293 at that time last year (up 46%) and 12,491 at the end of April (up 9%); New Listings in May were down 10% compared to April 2024, up 12% compared to May 2023, down 0.1% compared to May 2022, down 11% compared to May 2021, up 72% compared to May 2020, and up 8% compared to May 2019. Month’s supply of total residential listings is up to 5 month’s supply from 4 (balanced market conditions) and sales to listings ratio of 42% compared to 39% in April 2024, 59% in May 2023, and 45% in May 2022. 

Month-over-month, the house price index is up 0.5% and in the last 6 months up 2.5%.

Vancouver Westside: Total Units Sold in May were 501 – up from 471 (6%) in April, up from 424 (18%) in March, down from 624 (20%) in May 2023, down from 582 (14%) in May 2022, down from 736 (32%) in May 2021, up from 264 (90%) in May 2020, and up from 460 (9%) in May 2019; Active Listings were at 2,962 at month end compared to 2,115 at that time last year (up 40%) and 2,778 at the end of April (up 7%); New Listings in May were down 11% compared to April 2024, up 12% compared to May 2023, up 4% compared to May 2022, down 11% compared to May 2021, up 79% compared to May 2020, and up 26% compared to May 2019. Month’s supply of total residential listings is steady at 6 month’s supply (balanced market conditions) and sales to listings ratio of 38% compared to 31% in April 2024, 53% in May 2023, and 46% in May 2022.

Month-over-month, the house price index is down 0.2% and in the last 6 months up 2.0%. 

Vancouver East Side: Total Units Sold in May were 329 – down from 349 (5%) in April, up from 285 (15%) in March, down from 360 (9%) in May 2023, up from 318 (3%) in May 2022, down from 474 (31%) in May 2021, up from 167 (97%) in May 2020, and up from 328 (0.3%) in May 2019; Active Listings were at 1,459 at month end compared to 1,006 at that time last year (up 45%) and 1,369 at the end of April (up 7%); New Listings in May were down 16% compared to April 2024, up 12% compared to May 2023, down 4% compared to May 2022, down 15% compared to May 2021, up 88% compared to May 2020, and up 19% compared to May 2019. Month’s supply of total residential listings is steady at 4 month’s supply (seller’s market conditions) and sales to listings ratio of 45% compared to 41% in April 2024, 56% in May 2023, and 45% in May 2022.

Month-over-month, the house price index is up 0.4% and in the last 6 months up 1.9%. 

North Vancouver: Total Units Sold in May were 245 – down from 248 (1%) in April, up from 187 (31%) in March, down from 288 (15%) in May 2023, down from 280 (12%) in May 2022, down from 358 (32%) in May 2021, up from 136 (80%) in May 2020, and down from 257 (5%) in May 2019; Active Listings were at 796 at month end compared to 514 at that time last year (up 55%) and 711 at the end of April (up 12%); New Listings in May were down 12% compared to April 2024, up 21% compared to May 2023, up 11% compared to May 2022, down 11% compared to May 2021, up 59% compared to May 2020, and up 4% compared to May 2019. Month’s supply of total residential listings is steady at 3 month’s supply (seller’s market conditions) and sales to listings ratio of 46% compared to 41% in April 2024, 66% in May 2023, and 58% in May 2022.

Month-over-month, the house price index is up 1.4% and in the last 6 months up 3.8%. 

West Vancouver: Total Units Sold in May were 67 – down from 70 (4%) in April, up from 53 (21%) in March, down from 80 (16%) in May 2023, down from 69 (3%) in May 2022, down from 90 (26%) in May 2021, up from 43 (56%) in May 2020, and down from 71 (6%) in May 2019; Active Listings were at 696 at month end compared to 529 at that time last year (up 32%) and 628 at the end of April (up 11%); New Listings in May were down 12% compared to April 2024, up 12% compared to May 2023, up 6% compared to May 2022, down 3% compared to May 2021, up 81% compared to May 2020, and up 11% compared to May 2019. Month’s supply of total residential listings is up to 10 month’s supply from 9 (buyer’s market conditions) and sales to listings ratio of 26% compared to 24% in April 2024, 35% in May 2023, and 28% in May 2022.

Month-over-month, the house price index is up 2.2% but in the last 6 months up 3.8%. 

Richmond: Total Units Sold in May were 299 – down from 336 (11%) in April, up from 279 (7%) in March, down from 396 (24%) in May 2023, down from 341 (12%) in May 2022, down from 505 (41%) in May 2021, up from 152 (97%) in May 2020, and up from 271 (10%) in May 2019; Active Listings were at 1,440 at month end compared to 1,043 at that time last year (up 38%) and 1,339 at the end of April (up 8%); New Listings in May were down 15% compared to April 2024, up 0.5% compared to May 2023, down 20% compared to May 2022, down 22% compared to May 2021, up 58% compared to May 2020, and down 16% compared to May 2019. Month’s supply of total residential listings is up to 5 month’s supply from 4 (balanced market conditions) and sales to listings ratio of 46% compared to 4% in April 2024, 61% in May 2023, and 42% in May 2022.

Month-over-month, the house price index is up 0.3% and in the last 6 months up 2.0%. 

Burnaby East: Total Units Sold in May were 31 – up from 30 (3%) in April, down from 32 (3%) in March, down from 39 (21%) in May 2023, up from 30 (3%) in May 2022, down from 53 (42%) in May 2021, up from 18 (72%) in May 2020, and up from 25 (24%) in May 2019; Active Listings were at 117 at month end compared to 90 at that time last year (up 30%) and 114 at the end of April (up 3%); New Listings in May were down 8% compared to April 2024, down 10% compared to May 2023, down 5% compared to May 2022, down 22% compared to May 2021, up 42% compared to May 2020, and up 22% compared to May 2019. Month’s supply of total residential listings is steady at 4 month’s supply (seller’s market conditions) and sales to listings ratio of 51% compared to 45% in April 2024, 57% in May 2023, and 47% in May 2022.

Month-over-month, the house price index is up 1.1% and in the last 6 months up 4.0%. 

Burnaby North: Total Units Sold in May were 166 – up from 162 (2%) in April, up from 109 (52%) in March, down from 195 (13%) in May 2023, down from 175 (5%) in May 2022, down from 241 (31%) in May 2021, up from 79 (110%) in May 2020, and up from 123 (35%) in May 2019; Active Listings were at 749 at month end compared to 450 at that time last year (up 66%) and 700 at the end of April (up 7%); New Listings in May were down 16% compared to April 2024, up 27% compared to May 2023, up 18% compared to May 2022, up 1% compared to May 2021, up 148% compared to May 2020, and up 39% compared to May 2019. Month’s supply of total residential listings is up to 5 month’s supply from 4 (balanced market conditions) and sales to listings ratio of 42% compared to 35% in April 2024, 63% in May 2023, and 53% in May 2022.

Month-over-month, the house price index is flat and in the last 6 months up 1.7%. 

Burnaby South: Total Units Sold in May were 127 – down from 143 (3%) in April, down from 142 (13%) in March, down from 233 (20%) in May 2023, down from 163 (7%) in May 2022, down from 231 (37%) in May 2021, up from 64 (81%) in May 2020, and down from 131 (2%) in May 2019; Active Listings were at 645 at month end compared to 404 at that time last year (up 60%) and 537 at the end of April (up 22%); New Listings in May were up 6% compared to April 2024, up 8% compared to May 2023, up 15% compared to May 2022, down 12% compared to May 2021, up 168% compared to May 2020, and up 7% compared to May 2019. Month’s supply of total residential listings is up to 5 month’s supply from 4 (balanced market conditions) and sales to listings ratio of 37% compared to 44% in April 2024, 73% in May 2023, and 54% in May 2022.

Month-over-month, the house price index is up 0.5% and in the last 6 months up 2.4%. 

New Westminster: Total Units Sold in May were 115 – up from 105 (10%) in April, up from 108 (6%) in March, down from 142 (19%) in May 2023, down from 117 (2%) in May 2022, down from 194 (41%) in May 2021, up from 73 (58%) in May 2020, and down from 127 (9%) in May 2019; Active Listings were at 428 at month end compared to 258 at that time last year (up 66%) and 408 at the end of April (up 5%); New Listings in May were down 14% compared to April 2024, up 4% compared to May 2023, down 14% compared to May 2022, down 21% compared to May 2021, up 38% compared to May 2020, and down 21% compared to May 2019. Month’s supply of total residential listings is up steady at 4 month’s supply (seller’s market conditions) and sales to listings ratio of 53% compared to 42% in April 2024, 69% in May 2023, and 47% in May 2022.

Month-over-month, the house price index is up 0.4% and in the last 6 months up 3.8%. 

Coquitlam: Total Units Sold in May were 228 – down from 238 (4%) in April, down from 235 (3%) in March, down from 284 (20%) in May 2023, down from 244 (7%) in May 2022, down from 350 (35%) in May 2021, up from 132 (72%) in May 2020, and up from 205 (14%) in May 2019; Active Listings were at 914 at month end compared to 555 at that time last year (up 65%) and 802 at the end of April (up 14%); New Listings in May were down 6% compared to April 2024, up 11% compared to May 2023, up 11% compared to May 2022, down 10% compared to May 2021, up 41% compared to May 2020, and down 1% compared to May 2019. Month’s supply of total residential listings is up to 4 month’s supply from 3 (seller’s market conditions) and sales to listings ratio of 44% compared to 43% in April 2024, 61% in May 2023, and 53% in May 2022.

Month-over-month, the house price index is flat and in the last 6 months up 2.1%. 

Port Moody: Total Units Sold in May were 58 – down from 73 (21%) in April, up from 45 (29%) in March, down from 87 (33%) in May 2023, up from 57 (2%) in May 2022, down from 102 (43%) in May 2021, up from 46 (26%) in May 2020, and up from 62 (6%) in May 2019; Active Listings were at 219 at month end compared to 184 at that time last year (up 19%) and 203 at the end of April (up 8%); New Listings in May were down 24% compared to April 2024, down 9% compared to May 2023, down 28% compared to May 2022, down 21% compared to May 2021, up 26% compared to May 2020, and down 4% compared to May 2019. Month’s supply of total residential listings is up to 4 month’s supply from 3 (seller’s market conditions) and sales to listings ratio of 48% compared to 45% in April 2024, 65% in May 2023, and 34% in May 2022.

Month-over-month, the house price index is up 1.0% and in the last 6 months down 2.2%. 

Port Coquitlam: Total Units Sold in May were 95 – down from 102 (7%) in April, up from 89 (10%) in March, up from 91 (4%) in May 2023, up from 91 (4%) in May 2022, down from 165 (42%) in May 2021, up from 60 (58%) in May 2020, and down from 132 (28%) in May 2019; Active Listings were at 278 at month end compared to 153 at that time last year (up 46%) and 254 at the end of April (up 9%); New Listings in May were down 8% compared to April 2024, up 18% compared to May 2023, down 18% compared to May 2022, down 30% compared to May 2021, up 91% compared to May 2020, and down 7% compared to May 2019. Month’s supply of total residential listings is up to 3 month’s supply from 2 (seller’s market conditions) and sales to listings ratio of 55% compared to 54% in April 2024, 62% in May 2023, and 43% in May 2022.

Month-over-month, the house price index is flat and in the last 6 months up 2.9%. 

Pitt Meadows: Total Units Sold in May were 30 – down from 32 (6%) in April, up from 29 (3%) in March, down from 39 (23%) in May 2023, up from 24 (25%) in May 2022, down from 54 (44%) in May 2021, up from 23 (30%) in May 2020, and down from 40 (25%) in May 2019; Active Listings were at 94 at month end compared to 71 at that time last year (up 32%) and 71 at the end of April (up 32%); New Listings in May were up 26% compared to April 2024, up 60% compared to May 2023, down 9% compared to May 2022, up 13% compared to May 2021, up 50% compared to May 2020, and up 20% compared to May 2019. Month’s supply of total residential listings is up to 3 month’s supply from 2 (seller’s market conditions) and sales to listings ratio of 41% compared to 56% in April 2024, 86% in May 2023, and 30% in May 2022.

Month-over-month, the house price index is down 0.8% and in the last 6 months up 4.9%.

Maple Ridge: Total Units Sold in May were 172 – down from 191 (10%) in April, down from 187 (8%) in March, down from 218 (21%) in May 2023, down from 178 (3%) in May 2022, down from 286 (40%) in May 2021, up from 111 (55%) in May 2020, and up from 171 (1%) in May 2019; Active Listings were at 850 at month end compared to 539 at that time last year (up 57%) and 817 at the end of April (up 4%); New Listings in May were down 9% compared to April 2024, up 16% compared to May 2023, down 23% compared to May 2022, up 1% compared to May 2021, up 96% compared to May 2020, and up 10% compared to May 2019. Month’s supply of total residential listings is up to 5 month’s supply from 4 (balanced market conditions) and sales to listings ratio of 42% compared to 43% in April 2024, 63% in May 2023, and 39% in May 2022.

Month-over-month, the house price index is up 0.2% and in the last 6 months up 3.3%. 

Ladner: Total Units Sold in May were 33 – the as 33 in April, up from 30 (10%) in March, down from 54 (39%) in May 2023, up from 28 (18%) in May 2022, down from 49 (33%) in May 2021, up from 20 (65%) in May 2020, and down from 41 (20%) in May 2019; Active Listings were at 139 at month end compared to 85 at that time last year (up 64%) and 121 at the end of April (up 15%); New Listings in May were down 4% compared to April 2024, up 52% compared to May 2023, up 15% compared to May 2022, up 17% compared to May 2021, up 58% compared to May 2020, and down 12% compared to May 2019. Month’s supply of total residential listings is steady at 4 month’s supply (seller’s market conditions) and sales to listings ratio of 43% compared to 42% in April 2024, 108% in May 2023, and 42% in May 2022.

Month-over-month, the house price index is down 0.1% and in the last 6 months up 3.4%. 

Tsawwassen: Total Units Sold in May were 40 – down from 51 (22%) in April, up from 34 (18%) in March, down from 62 (35%) in May 2023, down from 44 (9%) in May 2022, down from 95 (58%) in May 2021, up from 35 (14%) in May 2020, and up from 38 (5%) in May 2019; Active Listings were at 218 at month end compared to 166 at that time last year (up 31%) and 204 at the end of April (up 7%); New Listings in May were down 7% compared to April 2024, up 9% compared to May 2023, down 12% compared to May 2022, down 23% compared to May 2021, up 14% compared to May 2020, and up 5% compared to May 2019. Month’s supply of total residential listings is up to 5 month’s supply from 4 (balanced market conditions) and sales to listings ratio of 40% compared to 48% in April 2024, 68% in May 2023, and 39% in May 2022. 

Month-over-month, the house price index is down 0.6% and in the last 6 months up 2.9%. 

Fraser Valley: Sales in May were up 3.1%, compared to April and were down 11.3% from April 2023. New listings were down 5.4% from April and up 6.4% from May 2023.The average price was up 2.5% month-over-month and is down 2.2% year-over-year. Active listings were up 8.1% to 7,904 from 7,313 last month and up 42.2% from May 2023 which was at 5,558. The Fraser Valley showed more sales activity in comparison to April this year and May last year, while seeing a slower growth in listings. 

“We are seeing an influx of inventory this spring, primarily due to slower than usual spring sales,” said Jeff Chadha, Chair of the Fraser Valley Real Estate Board. “Growing inventory levels are helping to create a healthy balance in the market, giving buyers more options, especially as prices continue to flatten.” 

Read

Will April Listings Bring May Sales?

Highlights of Dexter’s April 2024 report

  • Spike in new listings in April – 64% above last year.

  • Buyers slowly moving back into the market

  • Townhomes showed a surge in sales in April

  • Vancouver’s East/West divide in sales activity 

With more listings, there must be more sales! Not often talked about but the term pent up supply is something that showed to be true with the surge of listings in April. New listings came on last month like we haven’t seen since the fast-paced market of 2021. With new listings in Greater Vancouver up 41% compared to March, buyers had far more to choose from in many areas. Even with the continued hesitation from the Bank of Canada with perhaps signs of that first interest rate cut coming further out, buyers have some decisions to make. Wait it out or take advantage of long sought after listings and jump on the almost 2% lower fixed rate mortgages that have been available in 2024. Almost like the Canucks waiting for the perfect shot, buyers hesitate for a rate cut that realistically doesn’t impact the mortgage product of almost all buyers since fixed rates are not tied directly to the Bank of Canada Rate. Perhaps the Bank of Canada’s first interest rate cut is a psychological move for buyers more than anything. Ask a mortgage broker, buyers are not taking up variable rate mortgages right now. That pent up demand can only wait so long.  

On April 16 the federal government released their annual budget. With a host of promises on building more housing, renter protections and the biggest change proposed being the change in how capital gains are taxed. Going from 50% of the gains being taxed to two thirds being taxed on gains above $250,000 signals that wealth is the target of the Federal Liberal Government. There were ripples through the property market as some owners sought to sell properties prior to the June 25th potential change in capital gains treatment. Short term gain for long term pain. While an attempt to fund programs and perhaps housing, this will be a disincentive to sell property and limit an already tight housing market from seeing more resale homes available for buyers. Metro Vancouver and many parts of Canada do not have a speculation problem, they have a property holding problem. Homeowners focus on keeping the properties they purchase, and this tax change will only intensify that focus. And with new federal and provincial anti-flipping taxes, again, this creates more of a disincentive to sell. Wrong policies at the wrong time. For those with the ability to purchase, it will only add to the value of the property you buy. As much as government policy tries to change the market, supply and demand will ultimately determine what the values are.

And for renters, expect to see landlords selling at a greater pace and less buyers investing to provide private rental stock in the future. Today’s policies, both federally and provincially, do not bode well for the supply of homes going into the future. With less strata resale homes being built, more onerous regulations for landlords, and a signal that investment in the property market is not welcome by our governments, expect this to impact the supply of rental and resale homes.

There were 2,831 properties sold in Greater Vancouver in April after seeing 2,415 properties sold in Greater Vancouver in March and 2,070 properties sold in February this year. This was a 3% increase from the 2,741 properties sold last year in April after a year-over-year decline in March. This is the 4th straight month-over-month gain in the number of properties sold, showing more buyers being enticed to the market by greater selection and adjustments to the current fixed rate mortgages. And in looking at the sales during the month, the pace moved quicker after mid-month which should lead to May producing yet again a month-over-month gain in the number of homes sold. It’s likely we could see a repeat of the sales in last May at 3,400 – which would be the first month over 3,000 sales since then. With the added number of listings, there will be more sales. Just don’t tell the Bank of Canada after their reluctance to decrease its rate during the spring for fears of heating up the spring market. 

With April sales up from last year, they were 12% below the 10-year-average after being 30% below the 10-year average in March and 23% below the 10-year-average in February. With demand increasing and even with an increase in the number of listings, multiple offers are still occurring. Some areas and product types continue to be in short supply leaving buyers with the spectre of competition. We are still not yet at balance overall in the market, but buyers have the greatest opportunity they have seen in long time – even with interest rates where they are.  Detached homes and condos showed the same level of sales in April compared to last year while townhouse sales were up 16% year-over-year. 

Even with the increased listings in April compared to the previous month, there are still only 4 months supply of homes overall in Greater Vancouver, which had fallen from 5 months in February and 6 months in January. Technically this is a seller’s market, but about as streaky a seller’s market as we’ve seen. It makes the Canucks look like a model of consistency. Vancouver’s West Side stayed at 6 months supply, even with a 54% increase in the number of new listings in April compared to March. Vancouver’s East Side stayed at 4 months, still a technical seller’s market, even with a 44% surge in listings compared to March and 78% more compared to April last year. It was the 22% increase in sales month-over-month that kept it at a seller’s market. Amazing how much of a divide there is within the city itself. North Vancouver continues at 3 months supply, surprising given the 82% increase in the number of new listings compared to March. Burnaby climbed to 4 months supply, on the heels of total sales lagging March and April last year, a similar story in New Westminster. Buyer’s take note in those areas! Port Moody showed a 62% month-over-month gain in sales while new listings were up 53% which pushed this market back to 3 month’s supply from 4. And the small markets of Port Coquitlam and Pitt Meadows remain at 2 months supply.  

If it seemed like there were more for sale and open house signs out there, that’s because there were 7,229 new listings in Greater Vancouver that came out in April. This was way above last year’s total of 4,399 new listings, producing another consecutive month of year-over-year increase in new listings. And this was the highest number of new listings by month since the spring of 2021, which was a real estate market like no other we’ve seen. Is this rush of listings fuel for a significant increase in sales? It will certainly add to the number of transactions and likely keep prices relatively flat over the next few months. 

The number of new listings in April were 29% above the 10-year average after March was at 9% below the 10-year average and February was right at the 10-year average. There was a feeling that many sellers were waiting for the spring market to come before listing, and that came to fruition in April. This is likely a result of pent-up supply and likely some sellers reacting to changes to government legislation for short term rental bans, tenancy changes, property flipping taxes and capital gains changes – oh my. What’s changed in real estate this year? More like what hasn’t. 

There were 12,491 active listings in Greater Vancouver at month end, compared to the 10,552 actives at the end of March and 9,634 at the end of February. The count of active listings is up significantly year-over-year though, with there being nearly 3,700 more at the end of April, or 42% more than the end of April 2023. The detached market overall has moved up to 6 months supply from 5.5 in March, keeping it in a balanced market. Vancouver’s East Side is bucking this trend though, sitting with 4 month’s supply and producing some interesting multiple offer sales. Townhomes remain at 3 months supply and condos stayed at 4 months supply - keeping both in seller’s market conditions. 

This is not yesterday’s real estate market. And while the numbers overall show seller’s market conditions, savvy buyers, and sellers with the help of their Dexter agent will find market activity will depend on the area and type of property. Look closely at the numbers to understand the market where you are. Absorption rates for detached were down to 33% from 44% while townhouses and condos were 44% and 42% from the previous month at 53% and 48% respectively. There simply are not enough townhomes being built in Metro Vancouver, and this will continue to be one of the most competitive segments of the market.  

If April was the bell weather month for listings, will those April listings translate into May sales? Or will the continued hangover of the Bank of Canada pulling their interest rate carrot away from Buyers keep many on the sidelines until that signal comes to start buying. Ask yourself if you are a buyer though, do you want to wait for everyone else or take advantage of a market that’s finally given some choice. 

Here’s a summary of the numbers:

Greater Vancouver: Total Units Sold in April were 2,831 - up from 2,415 (17%) in March, up from 2,070 (37%) in February, up from 2,741 (3%) in April 2023, down from 3,281 (14%) in April 2022, down from 5,010 (44%) in April 2021, up from 1,119 (153%) in April 2020, up from 1,850 (53%) in April 2019; Active Listings were at 12,491 at month end compared to 8,790 at that time last year (up 42%) and 10,552 at the end of March (up 18%); New Listings in April were up 41% compared to March 2024, up 64% compared to April 2023, up 15% compared to April 2022, down 10% compared to April 2021, up 201% compared to April 2020, and up 23% compared to April 2019. Month’s supply of total residential listings is steady at 4 month’s supply (seller’s market conditions) and sales to listings ratio of 39% compared to 47% in March 2024, 62% in April 2023, and 52% in April 2022. 

Month-over-month, the house price index is up 0.8% and in the last 6 months up 0.8%.

Vancouver Westside: Total Units Sold in April were 471 - up from 424 (11%) in March, up from 374 (26%) in February, up from 468 (3%) in April 2023, down from 619 (24%) in April 2022, down from 764 (38%) in April 2021, up from 195 (142%) in April 2020, up from 342 (38%) in April 2019; Active Listings were at 2,778 at month end compared to 1,992 at that time last year (up 39%) and 2,342 at the end of March (up 19%); New Listings in April were up 54% compared to March 2024, up 78% compared to April 2023, up 17% compared to April 2022, down 3% compared to April 2021, up 235% compared to April 2020, and up 28% compared to April 2019. Month’s supply of total residential listings is steady at 6 month’s supply (balanced market conditions) and sales to listings ratio of 31% compared to 44% in March 2024, 56% in April 2023, and 48% in April 2022. 

Month-over-month, the house price index is up 1.0% and in the last 6 months up 1.4%. 

Vancouver East Side: Total Units Sold in April were 349 - up from 285 (22%) in March, up from 249 (40%) in February, up from 267 (31%) in April 2023, down from 355 (2%) in April 2022, down from 557 (37%) in April 2021, up from 120 (191%) in April 2020, up from 215 (62%) in April 2019; Active Listings were at 1,369 at month end compared to 939 at that time last year (up 46%) and 1,198 at the end of March (up 14%); New Listings in April were up 44% compared to March 2024, up 78% compared to April 2023, up 28% compared to April 2022, down 17% compared to April 2021, up 248% compared to April 2020, and up 45% compared to April 2019. Month’s supply of total residential listings is steady at 4 month’s supply (seller’s market conditions) and sales to listings ratio of 41% compared to 48% in March 2024, 55% in April 2023, and 53% in April 2022. 

Month-over-month, the house price index is up 1.0% and in the last 6 months up 0.4%. 

North Vancouver: Total Units Sold in April were 248 - up from 187 (33%) in March, up from 163 (52%) in February, up from 218 (14%) in April 2023, down from 275 (10%) in April 2022, down from 478 (48%) in April 2021, up from 96 (158%) in April 2020, up from 149 (66%) in April 2019; Active Listings were at 711 at month end compared to 495 at that time last year (up 44%) and 523 at the end of March (up 36%); New Listings in April were up 82% compared to March 2024, up 82% compared to April 2023, up 28% compared to April 2022, down 10% compared to April 2021, up 173% compared to April 2020, and up 18% compared to April 2019. Month’s supply of total residential listings is steady at 3 month’s supply (seller’s market conditions) and sales to listings ratio of 41% compared to 56% in March 2024, 66% in April 2023, and 58% in April 2022.

Townhouse new listings were double the amount of April 2023 yet remain with only 2 months supply, while condo inventory saw the biggest jump on the North Shore pushing that segment to 3 months supply. Month-over-month, the house price index is down 0.1% and in the last 6 months no change. 

West Vancouver: Total Units Sold in April were 70 - up from 53 (32%) in March, up from 56 (25%) in February, up from 69 (1%) in April 2023, down from 72 (3%) in April 2022, down from 116 (40%) in April 2021, up from 29 (141%) in April 2020, up from 48 (46%) in April 2019; Active Listings were at 628 at month end compared to 491 at that time last year (up 28%) and 560 at the end of March (up 12%); New Listings in April were up 56% compared to March 2024, up 60% compared to April 2023, up 21% compared to April 2022, up 2% compared to April 2021, up 209% compared to April 2020, and up 19% compared to April 2019. Month’s supply of total residential listings is down to 9 month’s supply (buyer’s market conditions) and sales to listings ratio of 24% compared to 28% in March 2024, 38% in April 2023, and 30% in April 2022.

Month-over-month, the house price index is up a shocking 31% but in the last 6 months down 1.2%. 

Richmond: Total Units Sold in April were 336 - up from 279 (20%) in March, up from 231 (45%) in February, down from 338 (1%) in April 2023, down from 426 (21%) in April 2022, down from 668 (56%) in April 2021, up from 137 (145%) in April 2020, up from 172 (109%) in April 2019; Active Listings were at 1,339 at month end compared to 1,062 at that time last year (up 26%) and 1,166 at the end of March (up 15%); New Listings in April were up 38% compared to March 2024, up 52% compared to April 2023, up 1% compared to April 2022, down 23% compared to April 2021, up 213% compared to April 2020, and up 10% compared to April 2019. Month’s supply of total residential listings is steady at 4 month’s supply (seller’s market conditions) and sales to listings ratio of 44% compared to 50% in March 2024, 67% in April 2023, and 56% in April 2022.  

Townhomes and condo listings saw the slowest growth in this municipality keeping them at 3 months supply while detached homes are up to 6 months. Month-over-month, the house price index is down 0.4% and in the last 6 months up 0.7%. 

Burnaby East: Total Units Sold in April were 30 - down from 32 (6%) in March, up from 25 (20%) in February, down from 34 (12%) in April 2023, down from 40 (25%) in April 2022, down from 76 (61%) in April 2021, up from 12 (150%) in April 2020, up from 15 (100%) in April 2019; Active Listings were at 114 at month end compared to 76 at that time last year (up 50%) and 101 at the end of March (up 13%); New Listings in April were up 25% compared to March 2024, up 43% compared to April 2023, down 4% compared to April 2022, down 41% compared to April 2021, up 106% compared to April 2020, and up 16% compared to April 2019. Month’s supply of total residential listings is up to 4 month’s supply (seller’s market conditions) and sales to listings ratio of 45% compared to 60% in March 2024, 81% in April 2023, and 58% in April 2022.  

Townhouse supply is the scarcest while keeping it at 2 months supply while detached homes are now at 6 months. Month-over-month, the house price index is up 0.6% and in the last 6 months up 1.7%. 

Burnaby North: Total Units Sold in April were 162 - up from 109 (49%) in March, up from 121 (34%) in February, down from 176 (8%) in April 2023, down from 164 (1%) in April 2022, down from 316 (49%) in April 2021, up from 40 (305%) in April 2020, up from 81 (100%) in April 2019; Active Listings were at 700 at month end compared to  415 that time last year (up 69%) and 535 at the end of March (up 31%); New Listings in April were up 53% compared to March 2024, up 77% compared to April 2023, up 33% compared to April 2022, down 0.5% compared to April 2021, up 240% compared to April 2020, and up 65% compared to April 2019. Month’s supply of total residential listings is down to 4 month’s supply (seller’s market conditions) and sales to listings ratio of 35% compared to 36% in March 2024, 67% in April 2023, and 47% in April 2022.

Condo sales are almost double that of March after the push of new listings in March, dropping inventory down to 4 months supply even with overall growth in active listings. Month-over-month, the house price index is up 0.1% and in the last 6 months down 0.5%. 

Burnaby South: Total Units Sold in April were 143 - up from 142 (1%) in March, up from 109 (31%) in February, down from 215 (33%) in April 2023, down from 186 (23%) in April 2022, down from 268 (47%) in April 2021, up from 55 (160%) in April 2020, up from 97 (47%) in April 2019; Active Listings were at 537 at month end compared to 385 at that time last year (up 39%) and 446 at the end of March (up 20%); New Listings in April were up 33% compared to March 2024, up 22% compared to April 2023, down 4% compared to April 2022, down 28% compared to April 2021, up 210% compared to April 2020, and up 15% compared to April 2019. Month’s supply of total residential listings is up to 4 month’s supply (seller’s market conditions) and sales to listings ratio of 44% compared to 58% in March 2024, 81% in April 2023, and 55% in April 2022. 

Sales overall down to last year, with condo sales less than March and April last year. An area of opportunity. Month-over-month, the house price index is up 1.0% and in the last 6 months up 1.0%. 

New Westminster: Total Units Sold in April were 105 - down from 108 (3%) in March, up from 79 (33%) in February, down from 113 (7%) in April 2023, down from 134 (22%) in April 2022, down from 199 (47%) in April 2021, up from 61 (72%) in April 2020, down from 108 (3%) in April 2019; Active Listings were at 408 at month end compared to 238 at that time last year (up 71%) and 350 at the end of March (up 17%); New Listings in April were up 17% compared to March 2024, up 54% compared to April 2023, up 21% compared to April 2022, down 17% compared to April 2021, up 183% compared to April 2020, and down 13% compared to April 2019. Month’s supply of total residential listings is up to 4 month’s supply (seller’s market conditions) and sales to listings ratio of 42% compared to 51% in March 2024, 70% in April 2023, and 65% in April 2022.

Detached sales down 50% to March and off last year’s total, pushing this segment into a buyer’s market. Month-over-month, the house price index is up 0.1% and in the last 6 months up 1.5%. 

Coquitlam: Total Units Sold in April were 238 - up from 235 (1%) in March, up from 189 (26%) in February, up from 210 (13%) in April 2023, down from 279 (15%) in April 2022, down from 362 (34%) in April 2021, up from 93 (156%) in April 2020, up from 153 (56%) in April 2019; Active Listings were at 802 at month end compared to 405 at that time last year (up 62%) and 663 at the end of March (up 21%); New Listings in April were up 29% compared to March 2024, up 62% compared to April 2023, up 12% compared to April 2022, down 11% compared to April 2021, up 190% compared to April 2020, and up 18% compared to April 2019. Month’s supply of total residential listings is steady at 3 month’s supply (seller’s market conditions) and sales to listings ratio of 43% compared to 55% in March 2024, 62% in April 2023, and 57% in April 2022.

With townhouse listings slow to come to market in April, sales fell off. While up to 3 months supply, it is still a seller’s market. Month-over-month, the house price index is up 0.3% and in the last 6 months up 0.7%. 

Port Moody: Total Units Sold in April were 73 - up from 45 (62%) in March, up from 46 (59%) in February, down from 91 (20%) in April 2023, up from 66 (11%) in April 2022, down from 126 (42%) in April 2021, up from 28 (161%) in April 2020, up from 60 (22%) in April 2019; Active Listings were at 203 at month end compared to 166 at that time last year (up 22%) and 160 at the end of March (up 27%); New Listings in April were up 53% compared to March 2024, up 61% compared to April 2023, down 35% compared to April 2022, down 9% compared to April 2021, up 188% compared to April 2020, and up 11% compared to April 2019. Month’s supply of total residential listings is down to 3 month’s supply (seller’s market conditions) and sales to listings ratio of 45% compared to 43% in March 2024, 91% in April 2023, and 55% in April 2022.

Townhouse sales were the highest since 2021 with limited listings coming on pushed that segment to 1 month supply – time to push for more supply. With only 68 in preliminary planning and 2 projects rejected and withdrawn, there’s little relief coming in this family centric community. Month-over-month, the house price index is up 2.1% and in the last 6 months down 0.6%. 

Port Coquitlam: Total Units Sold in April were 102 - up from 89 (15%) in March, up from 64 (59%) in February, up from 76 (34%) in April 2023, down from 117 (13%) in April 2022, down from 167 (39%) in April 2021, up from 42 (143%) in April 2020, up from 67 (52%) in April 2019; Active Listings were at 254 at month end compared to 137 at that time last year (up 85%) and 213 at the end of March (up 19%); New Listings in April were up 36% compared to March 2024, up 146% compared to April 2023, down 1% compared to April 2022, down 27% compared to April 2021, up 144% compared to April 2020, and down 3% compared to April 2019. Month’s supply of total residential listings is steady at 2 month’s supply (seller’s market conditions) and sales to listings ratio of 54% compared to 64% in March 2024, 97% in April 2023, and 61% in April 2022.

Detached sales surged, up 75% year-over-year with townhouse and condo sales not far behind. With only 20 townhomes planned in this community, supply will be scarce in the years to come – can you say missing middle? Month-over-month, the house price index is up 1.3% and in the last 6 months up 1.6%. 

Pitt Meadows: Total Units Sold in April were 32 - up from 29 (10%) in March, up from 23 (39%) in February, up from 27 (19%) in April 2023, down from 45 (29%) in April 2022, down from 48 (33%) in April 2021, up from 19 (68%) in April 2020, up from 28 (14%) in April 2019; Active Listings were at 71 at month end compared to 84 at that time last year (down 15%) and 66 at the end of March (up 8%); New Listings in April were up 36% compared to March 2024, up 5% compared to April 2023, down 2% compared to April 2022, down 17% compared to April 2021, up 84% compared to April 2020, and down 21% compared to April 2019. Month’s supply of total residential listings is steady at 2 month’s supply (seller’s market conditions) and sales to listings ratio of 56% compared to 69% in March 2024, 50% in April 2023, and 77% in April 2022.

Month-over-month, the house price index is up 0.9% and in the last 6 months up 4.9%.

Maple Ridge: Total Units Sold in April were 191 - up from 187 (2%) in March, up from 145 (32%) in February, up from 161 (19%) in April 2023, down from 166 (15%) in April 2022, down from 342 (44%) in April 2021, up from 82 (133%) in April 2020, up from 124 (54%) in April 2019; Active Listings were at 817 at month end compared to 506 at that time last year (up 61%) and 714 at the end of March (up 14%); New Listings in April were up 19% compared to March 2024, up 71% compared to April 2023, down 4% compared to April 2022, down 1% compared to April 2021, up 193% compared to April 2020, and up 30% compared to April 2019. Month’s supply of total residential listings is steady at 4 month’s supply (seller’s market conditions) and sales to listings ratio of % 43compared to 50% in March 2024, 62% in April 2023, and 36% in April 2022.

Month-over-month, the house price index is up 1.8% and in the last 6 months up 1.7%. 

Ladner: Total Units Sold in April were 33 - up from 30 (10%) in March, up from 23 (43%) in February, down from 43 (23%) in April 2023, down from 34 (3%) in April 2022, down from 74 (59%) in April 2021, up from 17 (94%) in April 2020, up from 29 (14%) in April 2019; Active Listings were at 121 at month end compared to 100 at that time last year (up 21%) and 90 at the end of March (up 34%); New Listings in April were up 49% compared to March 2024, up 36% compared to April 2023, down 41% compared to April 2022, down 14% compared to April 2021, up 119% compared to April 2020, and up 22% compared to April 2019. Month’s supply of total residential listings is up to 4 month’s supply (seller’s market conditions) and sales to listings ratio of 42% compared to 57% in March 2024, 74% in April 2023, and 61% in April 2022.

Month-over-month, the house price index is up 1.5% and in the last 6 months up 1.4%. 

Tsawwassen: Total Units Sold in April were 51 - up from 34 (50%) in March, up from 38 (34%) in February, down from 54 (6%) in April 2023, up from 46 (11%) in April 2022, down from 82 (38%) in April 2021, up from 24 (113%) in April 2020, up from 18 (183%) in April 2019; Active Listings were at 204 at month end compared to 167 at that time last year (up 22%) and 172 at the end of March (up 19%); New Listings in April were up 51% compared to March 2024, up 45% compared to April 2023, up 30% compared to April 2022, down 14% compared to April 2021, up 149% compared to April 2020, and down 2% compared to April 2019. Month’s supply of total residential listings is down to to 4 month’s supply (seller’s market conditions) and sales to listings ratio of 48% compared to 48% in March 2024, 73% in April 2023, and 56% in April 2022.  

Townhouse inventory is showing little growth with most new product sold out and little on the way. Month-over-month, the house price index is up 1.5% and in the last 6 months up 3.2%. 

Fraser Valley: Sales in April were up 5.4%, compared to March and were down 5.3% from April 2023. New listings were up 33.2% from March and up 60.5% from April 2023.The average price was down 1.0% month-over-month and is up 1.8% year-over-year. Active listings were up 18.0% to 7,313 from 6,197 last month and up 57.9% from April 2023 which was at 4,632. Like Greater Vancouver, listings surged in April for the Fraser Valley real estate market, a great opportunity for buyers. 

“We are seeing a relatively calm and balanced market right now,” said Jeff Chadha, Chair of the Fraser Valley Real Estate Board. “Which means buyers have time to shop around and purchase a home without the pressure of a few years ago, and while prices are holding fairly steady across all property types.” 

Kevin Skipworth, Partner/Broker and Chief Economist at Dexter Realty

Read

Sales and Listing Report for Mar 2024

Highlights of Dexter’s March 2024 report

  • 5% fewer homes sold in Greater Vancouver compared to March 2023

  • 15% more homes were listed for sale compared to March 2023

  • Spring Break turned into a real estate break

  • Burnaby North sees a surge in new condo listings

Spring break took some of the life out of the real estate market this year, especially with Easter at the end. At the mid-point of the month, there were 3,000 new listings which was on target to bring on 6,000 for the first time since the spring of 2022. With only 5,112 at the end of March, it appears a break was indeed what many took. That 6,000 number could come in April though as this pent-up real estate market continues to simmer with many waiting to act. Buyers were also more absent in the last half as the month finished with 2,415 sales – down from the 2,535 sales in March 2023. At the mid-point of March, there were 1,300 sales, the last half decline was evident in the final numbers. Expect buyers and sellers to get back to the market with more urgency with April upon us.

The wait continues for the next Bank of Canada announcement on April 10th which will yield no changes to their rate which affects variable rate mortgages. It will be the tone of the announcement that will play into how the market reacts. With June or July being the first potential rate cut according to many economists, the tone from the Bank of Canada will continue to be the most important part of the announcements. Economic data on inflation and the health of the economy play into the Bank of Canada’s decision on changes to their rate. Signs had been pointing to a rate cut sooner rather than later but with the Canadian GDP showing stronger numbers in February, that may not rush a decision to lower rates. With revised inflation and economic forecasts coming at the April meeting, we’ll get a better sense of when rates will start to come down.

On April 16 the federal government will release their annual budget. What housing initiatives will come with that budget this year? The Liberal Government has already come out talking about launching a renter’s bill of rights. With housing continually on the minds of the government right now and without any recent government policies showing any ability to tame the market, it will be interesting to see if anything else comes from this budget. The provincial government announced its much talked about anti-flipping tax during their budget this year as governments continue their assault on demand. And this week, the NDP government in B.C. strengthened restrictions on landlord use of property evictions. With more than one million people coming to Canada in each of the last two years, supply is where the focus needs to be. With recent reports stating that 741,000 new homes are needed each year through 2030, and with just 223,000 housing starts in 2023, recent government policy only serves to decrease supply and limit investor involvement. And without that capital, fewer homes will be built for renters and owners.

There were 2,415 properties sold in Greater Vancouver in March after seeing 2,070 properties sold in February, and 1,427 properties sold in January this year. This was a 5% decrease from the 2,535 properties sold last year in March. After the first quarter of 2024, sales are up 9.7% compared to the first 3 months of 2023. With Easter at the end of spring break this year, the effects from the school break were felt to a greater degree. Both sales and new listings fell back after mid-month with buyers and sellers focussed on other things. Since the middle of February, the number of sales per day have been consistent rising from 116 in the latter half of February to 120 per day in March. Albeit not quite the increase you’d expect in a spring market.

With March sales down from last year, this translated into sales being 30% below the 10-year-average after they were 23% below the 10-year-average in February, and 22% below the 10-year average in January. With demand still showing signs of waiting for rate changes in buyers’ favour, activity levels are on the lower side. While multiple offers are occurring in the marketplace, it’s very much dependent on how many are listed around it, where the property is and how it is priced. Detached homes and townhomes are the most popular and shortest in supply, so it’s not surprising to see multiple offers occurring more so with those segments. April could see more buyers focus on the market with spring break and Easter out of the way, and a closer path to interest rates coming down – if the economy cooperates.

With the increased sales in March compared to the previous month, we saw a drop to 4 months supply of homes overall in Greater Vancouver, falling from 5 months in February and 6 months in January. Technically this makes it a seller’s market – although we’ve seen this act before. Low inventories create an illusion of a true seller’s markets, but not for all properties. This could change if we see significantly more listings come on the market in April with there being nearly 2,000 more active listings now compared to a year ago. Vancouver’s West Side stayed at 6 months supply and Vancouver’s East Side stayed at 4 months (a technical seller’s market) even with a surge in listings over the last year. The growth in new listings year-over-year was slower in Vancouver with sales near the same levels as March 2023 (although detached sales on Vancouver’s West Side were down 31% year-over-year and down 3% month-over-month). North Vancouver continues at 3 months supply with its perpetually low inventory, and Burnaby remains at 3 months, except in Burnaby North where 5 months supply is available because of over 100 new listings for brand new and recently completed condos at Lougheed Mall and around Brentwood. Port Moody finished with nearly half the sales of March 2023 and bumped up to 4 months supply while Port Coquitlam had more sales and fewer new listings leaving that municipality with 2 months supply.

Even though it felt like more homes were coming on the market, there were only 5,112 new listings in Greater Vancouver. This was above last year’s total of 4,427 new listings, producing another consecutive month of year-over-year increase in new listings. After the first quarter in 2024, total new listings are 20% more than the first quarter of 2023. That is helping to add to the active listing count.

The number of new listings in March were 9% below the 10-year average after February was right at the 10-year average, taking us back to the previous few months which saw the level of new listings below the average. Whether spring break or playing the waiting game, some sellers just as much as buyers are holding off.

There were 10,552 active listings in Greater Vancouver at month end, compared to the 9,634 active at the end of February and 8,633 active listings at the end of January. The count of active listings is up year-over-year though, with there being nearly 2,000 more at the end of March compared to 8,617 at the end of March 2023. The detached market overall has come down to 5.5 months of supply from 6 in February and 8 in January, keeping it in a balanced market. Townhomes have dropped down to 3 months supply from 4 and condos stayed at 4 months supply - keeping both in seller’s market conditions. Even with the elevated supply of detached properties, year-over-year House Price Index was up 7.4%, compared with 5.0% for townhouses and 5.7% for condos. Land continues to be the best investment.

Depending on price point and area though, some may be more in balanced market conditions. Absorption rates for detached were up to 44% from 39% for the month while townhouses and condos were 53% and 48% from the previous month at 48% and 47% respectively. All segments saw lower absorption rates compared to last year in March, because of the increase in new listings this month and hence the subsequent rise in total active listings.

April is shaping up to be a bell weather month. With listing inventory ready to take off – 1,235 new listings within the first two days of April already, and buyers circling while waiting for the right time to jump in the market, it could produce a healthier pace of sales that sees buyers and sellers win. With limited inventory over the last 10 years, prices haven’t faced the downward pressure that would be expected with the slower pace of the market. The real estate market in Metro Vancouver has a long way to go to get to balance, but every listing helps. And with each new listings, comes another opportunity for the many buyers that are waiting.

Here’s a summary of the numbers:

Greater Vancouver: Total Units Sold in March were 2,415 - up from 2,070 (17%) in February, up from 1,427 (69%) in January, down from 2,535 (5%) in March 2023, down from 4,505 (46%) in March 2022, down from 5,843 (59%) in March 2021, down from 2,562 (6%) in March 2020, up from 1,745 (38%) in March 2019; Active Listings were at 10,552 at month end compared to 8,617 at that time last year and 9,634 at the end of February; New Listings in March were up 10% compared to February 2024, up 15% compared to March 2023, down 25% compared to March 2022, down 40% compared to March 2021, up 13% compared to March 2020, and up 1% compared to March 2019. Month’s supply of total residential listings is down to 4 month’s supply (seller’s market conditions) and sales to listings ratio of 47% compared to 45% in February 2024, 57% in March 2023, and 65% in March 2022. Month-over-month, the house price index is up 1.1% and in the last 6 months down 0.6%.

Vancouver Westside: Total Units Sold in March were 424 - up from 374 (13%) in February, up from 245 (73%) in January, down from 449 (6%) in March 2023, down from 800 (47%) in March 2022, down from 883 (52%) in March 2021, down from 467 (9%) in March 2020, up from 333 (27%) in March 2019; Active Listings were at 2,342 at month end compared to 1,977 at that time last year and 2,148 at the end of February; New Listings in March were up 4% compared to February 2024, up 5% compared to March 2023, down 28% compared to March 2022, down 34% compared to March 2021, up 15% compared to March 2020, and down 2% compared to March 2019. Month’s supply of total residential listings is steady at 4 month’s supply (balanced market conditions) and sales to listings ratio of 44% compared to 40% in February 2024, 49% in March 2023, and 59% in March 2022.

Sales for townhouses are up 34% year-over-year, while condo sales are down 3%. Month-over-month, the house price index is down 0.1% and in the last 6 months down 0.9%.

Vancouver East Side: Total Units Sold in March were 285 - up from 249 (14%) in February, up from 164 (74%) in January, down from 287 (1%) in March 2023, down from 497 (43%) in March 2022, down from 661 (57%) in March 2021, down from 297 (4%) in March 2020, up from 174 (64%) in March 2019; Active Listings were at 1,198 at month end compared to 899 (up 33%) at that time last year and 1,109 at the end of February; New Listings in March were up 9% compared to February 2024, up 30% compared to March 2023, down 23% compared to March 2022, down 41% compared to March 2021, up 29% compared to March 2020, and up 17% compared to March 2019. Month’s supply of total residential listings is steady 4 month’s supply (seller’s market conditions) and sales to listings ratio of 48% compared to 46% in February 2024, 62% in March 2023, and 68% in March 2022. Month-over-month, the house price index is up 1.2% and in the last 6 months down 1.5%.

North Vancouver: Total Units Sold in March were 187 - up from 163 (15%) in February, up from 117 (60%) in January, down from 215 (13%) in March 2023, down from 345 (46%) in March 2022, down from 470 (60%) in March 2021, down from 204 (8%) in March 2020, up from 165 (13%) in March 2019; Active Listings were at 523 at month end compared to 479 at that time last year and 489 at the end of February; New Listings in March were down 3% compared to February 2024, down 10% compared to March 2023, down 32% compared to March 2022, down 53% compared to March 2021, down 7% compared to March 2020, and down 15% compared to March 2019. Month’s supply of total residential listings is steady at 3 month’s supply (seller’s market conditions) and sales to listings ratio of 56% compared to 48% in February 2024, 58% in March 2023, and 71% in March 2022.

Detached new listings were down 26% year-over-year, with townhomes and condos at 2 months supply. Month-over-month, the house price index is up 1.7% and in the last 6 months up 0.4%.

West Vancouver: Total Units Sold in March were 53 - down from 56 (5%) in February, up from 23 (130%) in January, down from 64 (17%) in March 2023, down from 87 (39%) in March 2022, down from 148 (64%) in March 2021, down from 56 (5%) in March 2020, up from 34 (56%) in March 2019; Active Listings were at 560 at month end compared to 463 at that time last year and 526 at the end of February; New Listings in March were up 10% compared to February 2024, up 15% compared to March 2023, up 2% compared to March 2022, down 36% compared to March 2021, up 12% compared to March 2020, and up 12% compared to March 2019. Month’s supply of total residential listings is up to 11 month’s supply (buyer’s market conditions) and sales to listings ratio of 28% compared to 33% in February 2024, 39% in March 2023, and 47% in March 2022.

Month-over-month, the house price index is up 2.3% and in the last 6 months down 3.9%.

Richmond: Total Units Sold in March were 279 - up from 231 (21%) in February, up from 161 (73%) in January, down from 352 (21%) in March 2023, down from 557 (50%) in March 2022, down from 768 (64%) in March 2021, down from 337 (17%) in March 2020, up from 178 (44%) in March 2019; Active Listings were at 1,166 at month end compared to 1,049 at that time last year and 1,088 at the end of February; New Listings in March were up 19% compared to February 2024, up 16% compared to March 2023, down 38% compared to March 2022, down 49% compared to March 2021, up 6% compared to March 2020, and down 18% compared to March 2019. Month’s supply of total residential listings is down to 4 month’s supply (seller’s market conditions) and sales to listings ratio of 50% compared to 50% in February 2024, 74% in March 2023, and 63% in March 2022.

Townhomes are down to 3 month’s supply with new listings for that segment down 14% year-over-year. Slow growth in active listings in this municipality. Month-over-month, the house price index is up 1.6% and in the last 6 months down 0.6%.

Burnaby East: Total Units Sold in March were 32 - up from 25 (28%) in February, up from 17 (88%) in January, up from 20 (60%) in March 2023, down from 56 (43%) in March 2022, down from 70 (54%) in March 2021, up from 27 (19%) in March 2020, up from 17 (88%) in March 2019; Active Listings were at 101 at month end compared to 85 at that time last year and 94 at the end of February; New Listings in March were down 12% compared to February 2024, up 13% compared to March 2023, down 21% compared to March 2022, down 48% compared to March 2021, up 10% compared to March 2020, and up 4% compared to March 2019. Month’s supply of total residential listings is down to 3 month’s supply (seller’s market conditions) and sales to listings ratio of 60% compared to 42% in February 2024, 43% in March 2023, and 84% in March 2022.

Condo sales double year-over-year with active listings totals down from February leaving 2 months supply. Month-over-month, the house price index is up 3.6% and in the last 6 months up 2.2%.

Burnaby North: Total Units Sold in March were 109 - down from 121 (10%) in February, up from 88 (23%) in January, down from 169 (36%) in March 2023, down from 257 (58%) in March 2022, down from 335 (67%) in March 2021, down from 130 (16%) in March 2020, up from 77 (42%) in March 2019; Active Listings were at 535 at month end compared to 388 at that time last year and 447 at the end of February; New Listings in March were up 22% compared to February 2024, up 28% compared to March 2023, down 14% compared to March 2022, down 32% compared to March 2021, up 37% compared to March 2020, and up 36% compared to March 2019. Month’s supply of total residential listings is up to 5 month’s supply (balanced market conditions) and sales to listings ratio of 36% compared to 49% in February 2024, 73% in March 2023, and 65% in March 2022.

Sales are down year-over-year and month-over-month, with condo active listings up 58% year-over-year. City of development! Month-over-month, the house price index is up 1.3% and in the last 6 months up 0.1%.

Burnaby South: Total Units Sold in March were 142 - up from 109 (30%) in February, up from 102 (39%) in January, up from 130 (9%) in March 2023, down from 213 (33%) in March 2022, down from 325 (56%) in March 2021, down from 143 (1%) in March 2020, up from 97 (46%) in March 2019; Active Listings were at 446 at month end compared to 408 at that time last year and 425 at the end of February; New Listings in March were up 17% compared to February 2024, up 3% compared to March 2023, down 32% compared to March 2022, down 47% compared to March 2021, up 11% compared to March 2020, and down 16% compared to March 2019. Month’s supply of total residential listings is down to 3 month’s supply (seller’s market conditions) and sales to listings ratio of 58% compared to 52% in February 2024, 55% in March 2023, and 59% in March 2022.

Month-over-month, the house price index is up 0.8% and in the last 6 months down 0.4%.

New Westminster: Total Units Sold in March were 108 - up from 79 (37%) in February, up from 54 (100%) in January, down from 204 (47%) in March 2023, down from 204 (47%) in March 2022, down from 245 (57%) in March 2021, down from 118 (8%) in March 2020, up from 81 (33%) in March 2019; Active Listings were at 350 at month end compared to 229 at that time last year and 300 at the end of February; New Listings in March were up 11% compared to February 2024, up 50% compared to March 2023, down 18% compared to March 2022, down 37% compared to March 2021, up 7% compared to March 2020, and up 4% compared to March 2019. Month’s supply of total residential listings is down to 3 month’s supply (seller’s market conditions) and sales to listings ratio of 51% compared to 41% in February 2024, 68% in March 2023, and 79% in March 2022.

Active listings up 52% year-over-year, with sales up over last month and March 2023. Month-over-month, the house price index is up 3.4% and in the last 6 months up 0.9%.

Coquitlam: Total Units Sold in March were 235 - up from 189 (24%) in February, up from 112 (110%) in January, up from 196 (20%) in March 2023, down from 400 (41%) in March 2022, down from 462 (49%) in March 2021, down from 202 (16%) in March 2020, up from 142 (65%) in March 2019; Active Listings were at 683 at month end compared to 473 at that time last year and 599 at the end of February; New Listings in March were up 15% compared to February 2024, up 39% compared to March 2023, down 30% compared to March 2022, down 32% compared to March 2021, up 9% compared to March 2020, and up 3% compared to March 2019. Month’s supply of total residential listings is steady at 3 month’s supply (seller’s market conditions) and sales to listings ratio of 55% compared to 51% in February 2024, 64% in March 2023, and 66% in March 2022.

Sales up year-over-year and month-over-month, with condo new listings up 47% to last year and townhomes new listings up 88%. Over half the condo actives are new or near new. Opportunities in this market. Month-over-month, the house price index is up 0.5% and in the last 6 months down 0.1%.

Port Moody: Total Units Sold in March were 45 - down from 46 (2%) in February, up from 31 (45%) in January, down from 80 (44%) in March 2023, down from 107 (58%) in March 2022, down from 134 (66%) in March 2021, down from 54 (17%) in March 2020, up from 38 (18%) in March 2019; Active Listings were at 160 at month end compared to 178 at that time last year and 131 at the end of February; New Listings in March were up 30% compared to February 2024, down 8% compared to March 2023, down 28% compared to March 2022, down 42% compared to March 2021, up 1% compared to March 2020, and up 11% compared to March 2019. Month’s supply of total residential listings is up to 4 month’s supply (seller’s market conditions) and sales to listings ratio of 43% compared to 57% in February 2024, 70% in March 2023, and 71% in March 2022.

Condo sales down the most in this market compared to 2023. Month-over-month, the house price index is up 0.5% and in the last 6 months down 1.5%.

Port Coquitlam: Total Units Sold in March were 89 - up from 64 (39%) in February, up from 43 (107%) in January, up from 69 (29%) in March 2023, down from 141 (37%) in March 2022, down from 205 (57%) in March 2021, down from 96 (7%) in March 2020, up from 59 (51%) in March 2019; Active Listings were at 213 at month end compared to 160 at that time last year and 198 at the end of February; New Listings in March were down 6% compared to February 2024, up 10% compared to March 2023, down 33% compared to March 2022, down 56% compared to March 2021, down 1% compared to March 2020, and down 17% compared to March 2019. Month’s supply of total residential listings is down to 2 month’s supply (seller’s market conditions) and sales to listings ratio of 64% compared to 43% in February 2024, 54% in March 2023, and 67% in March 2022.

Townhome and condo sales are up significantly from March 2023 with few condo actives listings available year-over-year. Month-over-month, the house price index is down 0.4% and in the last 6 months down 0.6%.

Pitt Meadows: Total Units Sold in March were 29 - up from 23 (26%) in February, up from 20 (45%) in January, up from 28 (4%) in March 2023, down from 55 (47%) in March 2022, down from 53 (45%) in March 2021, down from 35 (17%) in March 2020, up from 24 (21%) in March 2019; Active Listings were at 66 at month end compared to 69 at that time last year and 64 at the end of February; New Listings in March were down 7% compared to February 2024, down 2% compared to March 2023, down 48% compared to March 2022, down 46% compared to March 2021, down 36% compared to March 2020, and down 24% compared to March 2019. Month’s supply of total residential listings is down to 2 month’s supply (seller’s market conditions) and sales to listings ratio of 69% compared to 51% in February 2024, 65% in March 2023, and 67% in March 2022.

Month-over-month, the house price index is up 3.1% and in the last 6 months up 2.8%.

Maple Ridge: Total Units Sold in March were 187 - up from 145 (29%) in February, up from 106 (76%) in January, up from 149 (26%) in March 2023, down from 264 (29%) in March 2022, down from 437 (64%) in March 2021, up from 170 (10%) in March 2020, up from 116 (61%) in March 2019; Active Listings were at 714 at month end compared to 495 at that time last year and 678 at the end of February; New Listings in March were down 7% compared to February 2024, up 42% compared to March 2023, down 15% compared to March 2022, down 32% compared to March 2021, up 25% compared to March 2020, and up 46% compared to March 2019. Month’s supply of total residential listings is down to 4 month’s supply (seller’s market conditions) and sales to listings ratio of 50% compared to 36% in February 2024, 54% in March 2023, and 60% in March 2022.

Month-over-month, the house price index is up 1.6% and in the last 6 months down 1.6%.

Ladner: Total Units Sold in March were 30 - up from 23 (30%) in February, up from 21 (43%) in January, down from 38 (21%) in March 2023, down from 46 (35%) in March 2022, down from 104 (71%) in March 2021, down from 32 (6%) in March 2020, up from 25 (20%) in March 2019; Active Listings were at 90 at month end compared to 100 at that time last year and 82 at the end of February; New Listings in March were up 43% compared to February 2024, down 23% compared to March 2023, down 27% compared to March 2022, down 60% compared to March 2021, up 21% compared to March 2020, and down 31% compared to March 2019. Month’s supply of total residential listings is down to 3 month’s supply (seller’s market conditions) and sales to listings ratio of 57% compared to 62% in February 2024, 55% in March 2023, and 63% in March 2022.

Month-over-month, the house price index is up 3.4% and in the last 6 months down 1.7%.

Tsawwassen: Total Units Sold in March were 34 - down from 38 (11%) in February, up from 24 (42%) in January, down from 35 (3%) in March 2023, down from 78 (56%) in March 2022, down from 106 (68%) in March 2021, down from 39 (13%) in March 2020, up from 15 (127%) in March 2019; Active Listings were at 172 at month end compared to 169 at that time last year and 156 at the end of February; New Listings in March were down 5% compared to February 2024, down 13% compared to March 2023, down 25% compared to March 2022, down 49% compared to March 2021, down 5% compared to March 2020, and down 16% compared to March 2019. Month’s supply of total residential listings is up to 5 month’s supply (balanced market conditions) and sales to listings ratio of 48% compared to 51% in February 2024, 43% in March 2023, and 82% in March 2022.

Month-over-month, the house price index is up 3.3% and in the last 6 months down 0.7%.

Fraser Valley: Sales in March were up 13.0%, compared to February and were down 10.0% from March 2023. New listings were up 6.8% from February and up 16.7% from March 2023.The average price was up 4.5% month-over-month and is up 9.2% year-over-year. Active listings were up 11.4% to 6,197 from 5,561 last month and up 36.7% from March 2023 which was at 4,533. Active listings continue to be on the rise after being at a low of 1,735 in December 2021. Month-over-month, the house price index is up 1.3% and in the last 6 months down 2.0%.

“With inventory building, buyers now have more opportunities in both the detached and attached markets compared to one year ago,” said Jeff Chadha, Chair of the Fraser Valley Real Estate Board. “However, despite increased options, some buyers may still be waiting on the sidelines for the financing landscape to further settle before they feel comfortable getting back into the market.”

Kevin Skipworth, Partner/Broker and Chief Economist at Dexter Realty

Read

Sales and Listing Report for Feb 2024

Highlights of Dexter’s February 2024 report

  • Buyers continue to show up! Number of sales in Greater Vancouver were up 45% from January

  • Sellers starting to show up, the number of new listings were up 20% from January 

  • Bank of Canada continues the holding pattern on its rate – fixed rates declining 

  • Sales in West Vancouver up 143% compared to January

At the mid-point of February, this month was as much a dark horse to hit 2,000 sales in Greater Vancouver as Billy Mack was to hit the #1 Christmas Song in Love Actually… and like this movie being 20 years old, the sales and new listings amounts feel like they are from 20 years ago. Lack of buyer and seller engagement continues to be one of the significant stories in the market. And as we’ve said before, Metro Vancouver real estate doesn’t have a speculation problem, it has a holding problem. Buyers are holding real estate and not turning into sellers which results in significantly less homes available for other buyers to purchase. But government policy continues to go after the demand side instead of encouraging supply from the existing home stock. Expecting new home construction to fill the void isn’t enough nor realistic.

With the Bank of Canada holding their rate at 5% at the latest meeting this morning, and with the U.S. holding at 5.5% so far this year, the wait continues as to when we might see the first rate cut. The sentiment is that it’s coming. Canadian and U.S. inflation is showing signs of easing, and with the Canadian economy showing signs of weakness, logic would say that rates should be coming down sooner rather than later. Employment numbers remain relatively flat though which isn’t helping in the obvious decision. Canada will likely wait for our neighbours to the south to make the first move, which may come in June when the U.S. has its more in-depth policy decision meeting.

There were 2,070 properties sold in Greater Vancouver in February after, 1,427 properties sold in January this year. This was a 13% increase from the 1,824 properties sold last year in February. Even with one more day in February this year, there were 103.5 sales per day compared to 96 sales per day last year. So, we can’t fully thank the extra day in the leap year for a better February. There is more buyer engagement. The latter half of the month certainly produced more sales, with the last week of the month showing 116 sales per day. A sign the real estate market is continuing to show more activity. This was also the first month where total sales were over 2,000 since August of last year as the fall suffered the fate of two summer interest rate increases by the Bank of Canada. Optimism is gaining in the market as buyers simply need to move on – literally. 

With this increase in activity, sales in February were 23% below the 10-year average, after sales in January were 22% below the 10-year average with sales in December 37% below the 10-year average and November’s sales at 35% below the 10-year average. We’re still within a slower moving market, and with a few more listings coming on this month, buyers were given opportunity. And moving forward, they should take advantage of it. February isn’t traditionally a strong month for sales, so expect March to produce more sales, even with spring break in the middle of it.

With the increase sales, we saw a drop to 5 months supply of homes overall in Greater Vancouver, falling back from 6 months in January and 7 months supply in December. Vancouver’s West Side dropped down to 6 months supply from 8 in January and Vancouver’s East Side declined to 4 months (a technical seller’s market) from 6 months in January. Vancouver saw fewer new listings in February compared to other areas of the region, while sales were up 53% compared to January on the West Side and 52% on the East Side. West Vancouver produced twice as many sales in February, bringing months supply down to 9 from 21. Detached sales in each of these cities showing more growth than the other sectors, signalling the upper end of the market is coming back perhaps. The perpetually under supplied North Vancouver dropped down to 3 months supply with condos there at 2 months supply. Further east, Burnaby and beyond have 4 months supply of homes available, with the Tri-Cities down to 3 months supply. Maple Ridge is the anomaly with 5 months supply after significant increase in new listings – up 92% compared to February last year and to 54% compared to January. Active listing counts are up 47% compared to this time last year. Buyers, Maple Ridge is where the opportunities are!

Even with the extra day in the month, we only saw 4,651 new listings in Greater Vancouver. This was well above last year’s total of 3,559 new listings, so that’s a good sign that sellers are coming back, perhaps in response to an uptick in buyer activity. Multiple offers have been occurring in the market more than last fall, an encouraging sign for those sellers that were afraid to enter a quiet market. The challenge of giving up lower mortgage rates continues for many homeowners through, unwilling to enter a higher mortgage rate to make a move. As renewals begin over the next few months and years and as rates start to come down, we’ll see this pent-up supply start to release more into the market. For some sellers, it may be better to take advantage of a lack of listings now and come on the market and work with a mortgage professional to find the right rate for now in anticipation of lower rates in the next few years. Date the rate and marry the house as they say. 

The number of new listings in January were right at the 10-year average, which is an improvement from January where they were 13% below the average and December with the number of new listings in that month being 25% below the 10-year average. 

There were 9,634 active listings in Greater Vancouver at month end, after there being 8,633 active listings in Greater Vancouver at the end of January and 8,283 at the end of February 2023. The detached market overall has come down to 6 months supply from 8, putting it into balanced market territory. Townhomes remain at 4 months supply and condos dropped to 4 months supply from 5 – putting both into seller market conditions. Depending on price point and area though, some may be more in balanced market conditions. Absorption rates for detached were 39% for the month while townhouses and condos were at 48% and 47% respectively. All segments saw lower absorption rates compared to last year in February, because of more new listings this year. As a result, we are seeing a gain in the active listing counts. This could bring more buyers to the market, again, a good sign for sellers.

Will March be the lion or the lamb in the real estate market. With a sizable increase in both sales and new listings in February compared to the previous month, will March continue down that path. After the provincial budget was announced, buyers and sellers will continue to navigate an incredible amount of policy changes by government, with an anti-flipping tax of 20% to start in 2025 introduced by the BC NDP.

The likely effect of this in the years to come will be a reduced number of listings as sellers hold on to properties more than they already are. Perhaps we’ll see a push to sell before 2024 ends though. Increased thresholds for the Property Transfer Tax exemptions starting April 1st will help those buyers purchasing up to $835,000 for resale and up to $1.1 million for newly constructed homes. The first-time homebuyer incentive has been discontinued at the federal level, much to the dismay of Dawson Creek which was the only region of B.C. where the program worked. Goodbye to bad legislation. Unfortunately, that was not the same for the Foreign Buyer Ban as the Federal Liberals announced a further two-year extension on that program which will now run until the end of 2026. All of which do not help but hinder supply of homes, which is the biggest challenge in the housing market, ironically identified by the government too. Too bad policy doesn’t align with reality.

Here’s a summary of the numbers:

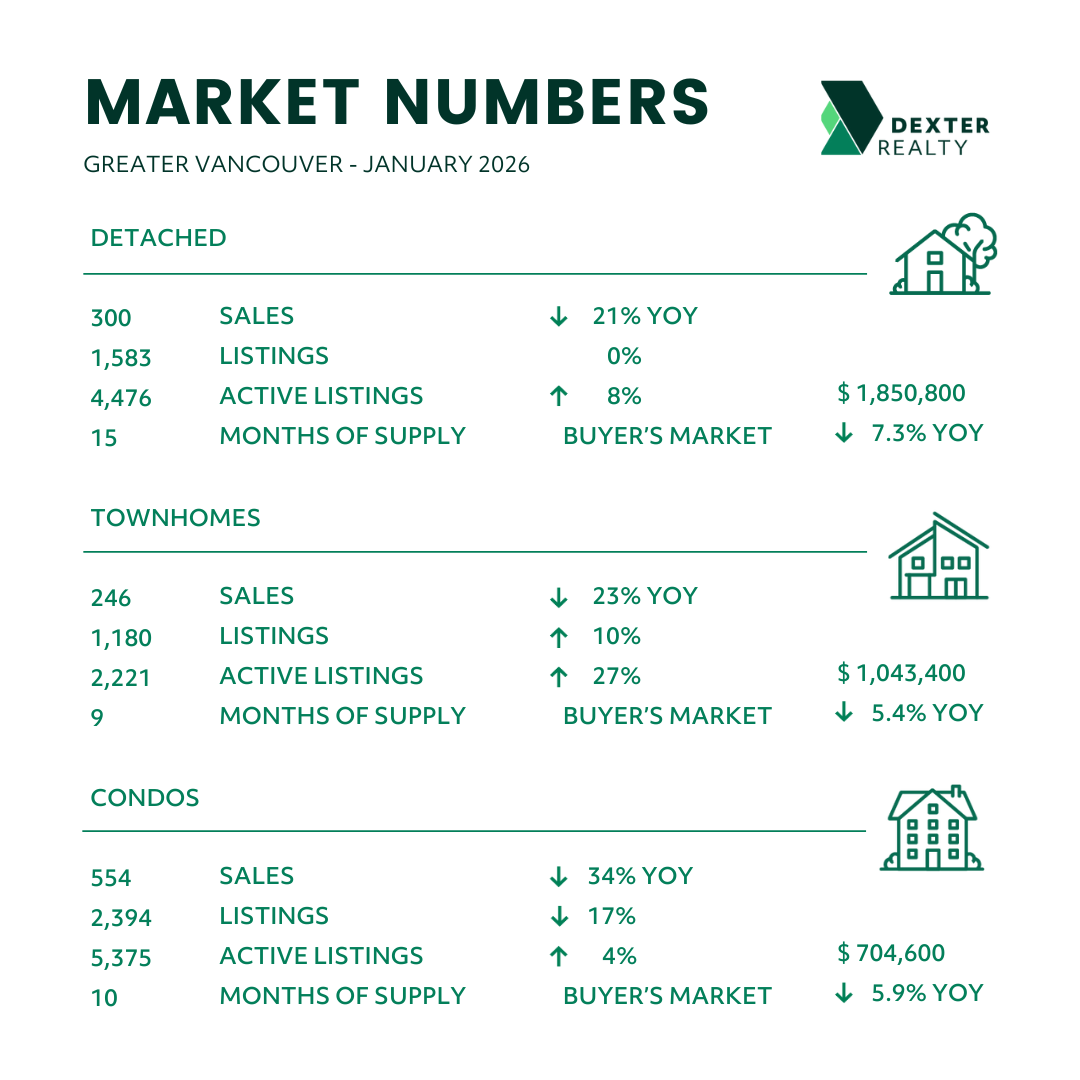
Greater Vancouver: Total Units Sold in February were 2,070 - up from 1,427 (45%) in January, up from 1,345 (54%) in December up from 1,824 (13%) in February 2023, down from 3,451 (40%) in February 2022, down from 3,852 (47%) in February 2021, down from 2,185 (5%) in February 2020, up from 1,512 (40%) in February 2019; Active Listings were at 9,634 at month end compared to 8,283 at that time last year and 8,633 at the end of January; New Listings in February were up 20% compared to January 2024, up 9% compared to February 2023, down 10% compared to February 2022, down 10% compared to February 2021, up 13% compared to February 2020, and up 17% compared to February 2019. Month’s supply of total residential listings is down to 5 month’s supply (balanced market conditions) and sales to listings ratio of 45% compared to 37% in January 2024, 51% in February 2023, 62% in February 2022, and 38% in February 2019. Month-over-month, the house price index is up 1.9% and in the last 6 months down 2.1%. Prices appear to be on the upswing after several months of seeing them decline through the fall.

Vancouver Westside: Total Units Sold in February were 374 - up from 245 (53%) in January, up from 235 (59%) in December up from 316 (18%) in February 2023, down from 665 (44%) in February 2022, down from 592 (37%) in February 2021, up from 367 (2%) in February 2020, up from 254 (47%) in February 2019; Active Listings were at 2,148 at month end compared to 1,923 at that time last year and 1,963 at the end of January; New Listings in February were up 10% compared to January 2024, up 31% compared to February 2023, down 15% compared to February 2022, down 1% compared to February 2021, up 32% compared to February 2020, and up 5% compared to February 2019. Month’s supply of total residential listings is down to 6 month’s supply (balanced market conditions) and sales to listings ratio of 40% compared to 29% in January 2024, 44% in February 2023, 61% in February 2022, and 29% in February 2019. Month-over-month, the house price index is up 4.0% and in the last 6 months down 0.7%.

Vancouver East Side: Total Units Sold in February were 249 - up from 164 (52%) in January, up from 148 (68%) in December up from 198 (26%) in February 2023, down from 359 (31%) in February 2022, down from 408 (39%) in February 2021, up from 243 (2%) in February 2020, up from 166 (50%) in February 2019; Active Listings were at 1,109 at month end compared to 900 at that time last year and 990 at the end of January; New Listings in February were up 9% compared to January 2024, up 43% compared to February 2023, down 16% compared to February 2022, down 6% compared to February 2021, up 23% compared to February 2020, and up 41% compared to February 2019. Month’s supply of total residential listings is down to 4 month’s supply (seller’s market conditions) and sales to listings ratio of 46% compared to 33% in January 2024, 52% in February 2023, 55% in February 2022, and 43% in February 2019. Month-over-month, the house price index is up 0.8% and in the last 6 months down 3.5%.

North Vancouver: Total Units Sold in February were 163 - up from 117 (39%) in January, up from 106 (52%) in December up from 1,824 (9%) in February 2023, down from 261 (38%) in February 2022, down from 318 (49%) in February 2021, down from 206 (21%) in February 2020, up from 124 (31%) in February 2019; Active Listings were at 489 at month end compared to 436 at that time last year and 414 at the end of January; New Listings in February were up 27% compared to January 2024, up 35% compared to February 2023, down 16% compared to February 2022, down 20% compared to February 2021, down 8% compared to February 2020, and up 2% compared to February 2019. Month’s supply of total residential listings is down to 3 month’s supply (seller’s market conditions) and sales to listings ratio of 48% compared to 43% in January 2024, 59% in February 2023, 64% in February 2022, and 37% in February 2019. Month-over-month, the house price index is up 1.5% and in the last 6 months down 1.8%.

West Vancouver: Total Units Sold in February were 56 - up from 23 (143%) in January, up from 41 (37%) in December up from 43 (30%) in February 2023, down from 80 (30%) in February 2022, down from 102 (45%) in February 2021, down from 57 (2%) in February 2020, up from 39 (44%) in February 2019; Active Listings were at 526 at month end compared to 443 at that time last year and 483 at the end of January; New Listings in February were down 5% compared to January 2024, up 11% compared to February 2023, down 21% compared to February 2022, up 6% compared to February 2021, up 19% compared to February 2020, and up 1% compared to February 2019. Month’s supply of total residential listings is down to 9 month’s supply from 21 in January (still buyer’s market conditions) and sales to listings ratio of 33% compared to 13% in January 2024, 28% in February 2023, 37% in February 2022, and 23% in February 2019. Month-over-month, the house price index is down 3.7% and in the last 6 months down 6.3%. 

Richmond: Total Units Sold in February were 231 - up from 161 (43%) in January, up from 169 (37%) in December up from 227 (2%) in February 2023, down from 340 (30%) in February 2022, down from 453 (49%) in February 2021, down from 253 (9%) in February 2020, up from 155 (49%) in February 2019; Active Listings were at 1,088 at month end compared to 1,036 at that time last year and 1,014 at the end of January; New Listings in February were up 13% compared to January 2024, up 1% compared to February 2023, down 34% compared to February 2022, down 30% compared to February 2021, down 8% compared to February 2020, and down 2% compared to February 2019. Month’s supply of total residential listings is down to 5 month’s supply (balanced market conditions) and sales to listings ratio of 50% compared to 39% in January 2024, 49% in February 2023, 56% in February 2022, and 33% in February 2019. Month-over-month, the house price index is up 2.9% and in the last 6 months down 1.2%.

Burnaby East: Total Units Sold in February were 25 - up from 17 (47%) in January, up from 18 (39%) in December up from 21 (19%) in February 2023, down from 34 (24%) in February 2022, down from 41 (37%) in February 2021, down from 32 (22%) in February 2020, up from 17 (47%) in February 2019; Active Listings were at 94 at month end compared to 71 at that time last year and 77 at the end of January; New Listings in February were up 20% compared to January 2024, up 200% compared to February 2023, down 7% compared to February 2022, down 6% compared to February 2021, up 58% compared to February 2020, and up 67% compared to February 2019. Month’s supply of total residential listings is down to 4 month’s supply (seller’s market conditions) and sales to listings ratio of 42% compared to 34% in January 2024, 105% in February 2023, 52% in February 2022, and 47% in February 2019. Month-over-month, the house price index is up 0.2% and in the last 6 months down 2.6%.

Burnaby North: Total Units Sold in February were 121 - up from 88 (38%) in January, up from 91 (33%) in December down from 134 (2%) in February 2023, down from 226 (46%) in February 2022, down from 193 (37%) in February 2021, up from 100 (21%) in February 2020, up from 84 (44%) in February 2019; Active Listings were at 447 at month end compared to 380 at that time last year and 387 at the end of January; New Listings in February were up 35% compared to January 2024, up 22% compared to February 2023, down 20% compared to February 2022, down 6% compared to February 2021, up 29% compared to February 2020, and up 56% compared to February 2019. Month’s supply of total residential listings is steady at 4 month’s supply (seller’s market conditions) and sales to listings ratio of 49% compared to 48% in January 2024, 66% in February 2023, 72% in February 2022, and 53% in February 2019. Month-over-month, the house price index is up 1.6% and in the last 6 months down 1.7%.

Burnaby South: Total Units Sold in February were 109 - up from 102 (7%) in January, up from 79 (38%) in December down from 118 (8%) in February 2023, down from 200 (45%) in February 2022, down from 201 (46%) in February 2021, up from 105 (4%) in February 2020, up from 83 (31%) in February 2019; Active Listings were at 425 at month end compared to 377 at that time last year and 398 at the end of January; New Listings in February were down 2% compared to January 2024, up 1% compared to February 2023, down 27% compared to February 2022, down 23% compared to February 2021, up 9% compared to February 2020, and up 0.5% compared to February 2019. Month’s supply of total residential listings is steady at 4 month’s supply (seller’s market conditions) and sales to listings ratio of 52% compared to 48% in January 2024, 57% in February 2023, 70% in February 2022, and 40% in February 2019. Month-over-month, the house price index is up 1.6% and in the last 6 months down 2.1%.

New Westminster: Total Units Sold in February were 79 - up from 54 (46%) in January, up from 46 (72%) in December up from 66 (20%) in February 2023, down from 159 (50%) in February 2022, down from 164 (52%) in February 2021, down from 90 (12%) in February 2020, up from 63 (25%) in February 2019; Active Listings were at 300 at month end compared to 222 at that time last year and 242 at the end of January; New Listings in February were up 43% compared to January 2024, up 79% compared to February 2023, down 15% compared to February 2022, down 12% compared to February 2021, up 25% compared to February 2020, and up 16% compared to February 2019. Month’s supply of total residential listings is steady at 4 month’s supply (seller’s market conditions) and sales to listings ratio of 41% compared to 40% in January 2024, 62% in February 2023, 70% in February 2022, and 38% in February 2019. Month-over-month, the house price index is up 0.7% and in the last 6 months down 3.1%.

Coquitlam: Total Units Sold in February were 189 - up from 112 (69%) in January, up from 119 (59%) in December up from 158 (20%) in February 2023, down from 264 (28%) in February 2022, down from 322 (41%) in February 2021, down from 196 (4%) in February 2020, up from 134 (41%) in February 2019; Active Listings were at 599 at month end compared to 466 at that time last year and 521 at the end of January; New Listings in February were up 29% compared to January 2024, up 56% compared to February 2023, down 17% compared to February 2022, down 9% compared to February 2021, up 13% compared to February 2020, and up 28% compared to February 2019. Month’s supply of total residential listings is down to 3 month’s supply (seller’s market conditions) and sales to listings ratio of 51% compared to 39% in January 2024, 67% in February 2023, 59% in February 2022, and 46% in February 2019. Month-over-month, the house price index is up 2.4% and in the last 6 months down 1.8%.

Port Moody: Total Units Sold in February were 46 - up from 31 (48%) in January, up from 25 (84%) in December down from 47 (2%) in February 2023, down from 87 (47%) in February 2022, down from 92 (50%) in February 2021, up from 36 (28%) in February 2020, up from 30 (53%) in February 2019; Active Listings were at 131 at month end compared to 200 at that time last year and 122 at the end of January; New Listings in February were up 47% compared to January 2024, down 11% compared to February 2023, down 32% compared to February 2022, down 38% compared to February 2021, down 26% compared to February 2020, and up 1% compared to February 2019. Month’s supply of total residential listings is down to 3 month’s supply (seller’s market conditions) and sales to listings ratio of 57% compared to 55% in January 2024, 52% in February 2023, 73% in February 2022, and 40% in February 2019. Month-over-month, the house price index is up 1.0% and in the last 6 months down 2.2%.

Port Coquitlam: Total Units Sold in February were 64 - up from 43 (49%) in January, up from 36 (78%) in December up from 40 (60%) in February 2023, down from 108 (40%) in February 2022, down from 122 (48%) in February 2021, down from 83 (23%) in February 2020, up from 60 (7%) in February 2019; Active Listings were at 198 at month end compared to 140 at that time last year and 155 at the end of January; New Listings in February were up 104% compared to January 2024, up 71% compared to February 2023, down 3% compared to February 2022, down 13% compared to February 2021, up 17% compared to February 2020, and up 6% compared to February 2019. Month’s supply of total residential listings is down to 3 month’s supply (seller’s market conditions) and sales to listings ratio of 43% compared to 59% in January 2024, 46% in February 2023, 71% in February 2022, and 43% in February 2019. Month-over-month, the house price index is up 3.2% and in the last 6 months down 1.2%.

Pitt Meadows: Total Units Sold in February were 23 - up from 20 (15%) in January, up from 15 (53%) in February 2023, down from 35 (34%) in February 2022, down from 48 (50%) in February 2021, down from 27 (15%) in February 2020, up from 15 (53%) in February 2019; Active Listings were at 64 at month end compared to 62 at that time last year and 57 at the end of January; New Listings in February were up 18% compared to January 2024, up 66% compared to February 2023, down 10% compared to February 2022, down 20% compared to February 2021, down 12% compared to February 2020, and up 10% compared to February 2019. Month’s supply of total residential listings is steady at 3 month’s supply (seller’s market conditions) and sales to listings ratio of 51% compared to 52% in January 2024, 55% in February 2023, 70% in February 2022, and 36% in February 2019. Month-over-month, the house price index is up 2.8% and in the last 6 months down 0.5%.

Maple Ridge: Total Units Sold in February were 145 - up from 106 (37%) in January, up from 129 (12%) in February 2023, down from 224 (35%) in February 2022, down from 292 (50%) in February 2021, down from 177 (18%) in February 2020, up from 100 (45%) in February 2019; Active Listings were at 678 at month end compared to 462 at that time last year and 563 at the end of January; New Listings in February were up 54% compared to January 2024, up 92% compared to February 2023, up 11% compared to February 2022, up 16% compared to February 2021, up 35% compared to February 2020, and up 94% compared to February 2019. Month’s supply of total residential listings is steady at 5 month’s supply (balanced market conditions) and sales to listings ratio of 36% compared to 40% in January 2024, 62% in February 2023, 62% in February 2022, and 48% in February 2019. Month-over-month, the house price index is up 1.1% and in the last 6 months down 3.6%.

Ladner: Total Units Sold in February were 23 - up from 21 (10%) in January, up from 12 (92%) in December down from 27 (15%) in February 2023, down from 26 (12%) in February 2022, down from 61 (63%) in February 2021, down from 36 (36%) in February 2020, up from 20 (15%) in February 2019; Active Listings were at 82 at month end compared to 98 at that time last year and 83 at the end of January; New Listings in February were up 20% compared to January 2024, down 39% compared to February 2023, down 35% compared to February 2022, down 55% compared to February 2021, up 45% compared to February 2020, and up 26% compared to February 2019. Month’s supply of total residential listings is steady at 4 month’s supply (seller’s market conditions) and sales to listings ratio of 62% compared to 46% in January 2024, 44% in February 2023, 46% in February 2022, and 40% in February 2019. Month-over-month, the house price index is up 0.4% and in the last 6 months down 5.0%.  

Tsawwassen: Total Units Sold in February were 38 - up from 24 (58%) in January, up from 21 (81%) in December up from 25 (52%) in February 2023, down from 73 (48%) in February 2022, down from 76 (50%) in February 2021, up from 32 (19%) in February 2020, up from 21 (81%) in February 2019; Active Listings were at 156 at month end compared to 146 at that time last year and 139 at the end of January; New Listings in February were up 47% compared to January 2024, up 42% compared to February 2023, down 26% compared to February 2022, down 27% compared to February 2021, up 39% compared to February 2020, and up 36% compared to February 2019. Month’s supply of total residential listings is down to 4 month’s supply (seller’s market conditions) and sales to listings ratio of 51% compared to 47% in January 2024, 47% in February 2023, 72% in February 2022, and 38% in February 2019. Month-over-month, the house price index is up 0.7% and in the last 6 months down 1.4%.

Fraser Valley: Sales in February were up 32% from January and up 38% from February 2023. New listings were up 18% from January and up 44% from February 2023. While the average price was down 0.1% month-over-month, it is up 8% year-over-year. Active listings were up 14% to 5,561 from 4,877 last month but up 26% from February 2023. After seeing steep declines, active listing counts in the region are climbing. It was a very precipitous decline over the last 3 months. Month-over-month, the house price index is up 0.9% and in the last 6 months down 4.2%. 

“There is somewhat of a buzz in the market right now,” said Narinder Bains, Chair of the Fraser Valley Real Estate Board. “We are seeing new listings come onto the market and REALTORS® continue to see more traffic at open houses, however buyers are still exercising caution. We aren’t out of the woods just yet, but the signs are pointing to a further increase in activity as we head into spring.” 

Kevin Skipworth, Partner/Broker and Chief Economist at Dexter Realty

Read

Sales and Listing Report for Jan 2024

Highlights of Dexter’s January 2024 report

  • Buyers are back! Sales in Greater Vancouver were up 39% from January 2023

  • Vancouver detached listings at the lowest level since December 2015

  • The number of new listings were only up 15% from January 2023

  • When will the Bank of Canada cut its rate?

  • The total number of sales in West Vancouver were the lowest by month since 2008

A new year, a new real estate market. Sort of. As 2024 took hold, buyers appeared to embrace homebuying more so than they did when 2023 began. Sales were up 39% in Greater Vancouver and 52% in the Fraser Valley year-over-year. Anticipation of future rate cuts were on the minds of many as they awaited the Bank of Canada’s first interest rate announcement in late January. While a rate cut wasn’t anticipated, the messaging of future rate cuts was on the minds of many. And while some predicted the next Bank of Canada meetings in March and April could be the first rate cut since the spate of increases starting in 2022, sticky inflation and a Canadian economy sidestepping a recession could keep the current Bank rate in check until June or July. Buyers don’t seem to want to wait though as market activity so far is indicating the pent-up demand can only hold off for so long.   

There were 1,427 properties sold in Greater Vancouver in January this year. This was a 39% increase from the 1,030 properties sold last year in January. And this was the first month-over-month increase in sales since May of last year. You can only keep a good market down for so long. Even with the deep freeze and snow event last month, buyers made their way out to go through the limited supply of listings, many surprised at how many were no longer available. As the temperature in January rose to finish the month, the real estate market seemed to see its temperature rise as well. Will February produce the first month with more than 2,000 sales since August? Likely yes, but that will require a few more sellers to join jump into the market as well. With this increase in activity, sales in January were 22% below the 10-year average after sales in December were 37% below the 10-year average and November’s sales were at 35% below the 10-year average. The trends and numbers certainly show an increase in buyer activity. Stats don’t lie.

With current sales, we continue to be in a balanced market with 6 months supply of homes overall in Greater Vancouver, falling back from 7 months supply in December. Vancouver’s West Side was higher in the region at 8 months supply and West Vancouver with its lowest monthly sales since December 2008 clocked in at 21 months supply of homes available. A severe buyer’s market. While its neighbour next door, North Vancouver, maintained its 4 months supply, doing its best seller’s market imitation. Burnaby North and South, New Westminster, Port Coquitlam, and Ladner all finished January with 4 months supply of listings. Ladner didn’t see any condo sales in January, but then again there are only 8 active listings and there were no new listings in December, proving you can’t buy what isn’t available. Pitt Meadows has the lowest supply in the region with only 3 months worth of listings available for buyers shopping in that city. 

With the precipitous drop in total listings we saw through the last two months of 2023, January saw 3,875 new listings. This was the third lowest number of new listings for the month of January since the year 2000. This after there were only 1,355 new listings in December after 3,440 new listings in November, but it was slightly higher than the number of new listings in January last year at 3,384. 

The number of new listings in January were 13% below the 10-year average, which is an improvement from December with the number of new listings in that month being 25% below the 10-year average. But still below the averages in the 3 months preceding December: 3% below the 10-year average in November, 5% above the 10-year average in October and 6% above the 10-year average in September. 

There were 8,633 active listings in Greater Vancouver at the end of January after seeing 8,802 active listings at the end of December. It’s rare to see the total number of active listings end with less in January then in December, but after several listings expired at the end of December, January started with 7,828 active listings. And with fewer new listings in January than is typical, that hole is hard to dig out of. Perhaps it’s a signal to sellers that the opportunity to list their home on the market is better than we’ve seen over the last year. Buyers are shopping and hoping that more sellers will list. The detached market overall remains in buyer’s market territory with 8 months supply of inventory, down from 9 months in December. Townhomes slipped down to 4 months supply and condos continue to sit just above 5 months supply of listings. The missing middle known as townhomes had a 42% absorption rate in January with sales up 82% compared to January last year. This was higher than detached at 33% absorption and sales 28% higher than January 2023 and condos at 37% absorption and sales 30% higher than January 2023. Perhaps the provincial government’s small-scale, multi-unit housing plan should have focused more on building more townhomes and row homes than 3 to 6 unit buildings scattered throughout the region.

As we start February, Ground Hogs in Canada indicated that we would see an early spring. Will we also see and early real estate market? The thought was it would depend on interest rates starting their decline, but with a little more uncertainty when that might happen, buyers seem to be wanting to get on finding their first or next home. January was an indication that buyers are back, but the question remains – where are the sellers? A slower decline in interest rates may produce a more balanced market, as long we see more listings come on the market. The sudden rise in interest rates is keeping supply out of the real estate market, not just resale, but the much-needed new product that will fuel buyers in the years to come.

Bank of Canada governor Tiff Macklem recently said that high interest rates aren’t to blame for the housing crisis and that it can’t solve the housing crisis with interest rates. That seems to fly in the face of that fact that elevated interest rates are keeping new development at bay as higher interest rates add to the cost of housing and risk for developers. The extension of the Foreign Buyer ban announced on February 4, which will be until 2027 may also limit supply and not provide more. The host of government regulations have not helped to build more supply in the real estate market and is doing the opposite.  

Here’s a summary of the numbers:

Greater Vancouver: Total Units Sold in January were 1,427 - up from 1,345 (6%) in December, down from 1,702 (16%) in November 2023, up from 1,030 (39%) in January 2023, down from 2,329 (39%) in January 2022, down from 2,454 (42%) in January 2021, down from 1,602 (11%) in January 2020, up from 1,102 (29%) in January 2019; Active Listings were at 8,633 at month end compared to 7,862 at that time last year and 8,802 at the end of December; New Listings in January were up 186% compared to December 2023, up 13% compared to November 2023, up 15% compared to January 2023, down 9% compared to January 2022, down 16% compared to January 2021, down 3% compared to January 2020, down 22% compared to January 2019. Month’s supply of total residential listings is down to 6 month’s supply (balanced market conditions) and sales to listings ratio of 37% compared to 99% in December 2023, 30% in January 2023 and 55% in January 2022. Month-over-month, the house price index is down 0.6% and in the last 6 months down 4.6%. 

Vancouver Westside: Total Units Sold in January were 245 - up from 235 (4%) in December, down from 315 (23%) in November 2023, up from 194 (26%) in January 2023, down from 445 (45%) in January 2022, down from 393 (38%) in January 2021, down from 275 (11%) in January 2020, up from 187 (31%) in January 2019; Active Listings were at 1,963 at month end compared to 1,827 at that time last year and 1,998 at the end of December (detached listings at 453 were the lowest amount since December 2015); New Listings in January were up 244% compared to December 2023, up 26% compared to November 2023, up 18% compared to January 2023, down 16% compared to January 2022, down 5% compared to January 2021, up 15% compared to January 2020, down 13% compared to January 2019. Month’s supply of total residential listings is down to 8 month’s supply (buyer’s market conditions) and sales to listings ratio of 29% compared to 95% in December 2023, 27% in January 2023 and 44% in January 2022. Month-over-month, the house price index is down 0.9% and in the last 6 months down 4.8%. 

Vancouver East Side: Total Units Sold in January were 164 - up from 148 (11%) in December, down from 175 (6%) in November 2023, up from 118 (39%) in January 2023, down from 257 (36%) in January 2022, down from 257 (36%) in January 2021, up from 161 (2%) in January 2020, up from 105 (56%) in January 2019; Active Listings were at 990 at month end compared to 867 at that time last year and 977 at the end of December; New Listings in January were up 240% compared to December 2023, up 23% compared to November 2023, up 40% compared to January 2023, up 5% compared to January 2022, down 2% compared to January 2021, up 40% compared to January 2020, up 10% compared to January 2019. Month’s supply of total residential listings is down to 6 month’s supply (balanced market conditions) and sales to listings ratio of 33% compared to 100% in December 2023, 33% in January 2023 and 54% in January 2022. Month-over-month, the house price index is down 0.6% and in the last 6 months down 3.5%. 

North Vancouver: Total Units Sold in January were 117 - up from 106 (10%) in December, down from 157 (25%) in November 2023, up from 82 (43%) in January 2023, down from 143 (19%) in January 2022, down from 179 (35%) in January 2021, up from 100 (17%) in January 2020, up from 91 (29%) in January 2019; Active Listings were at 414 at month end compared to 416 at that time last year and 392 at the end of December; New Listings in January were up 171% compared to December 2023, up 1% compared to November 2023, up 17% compared to January 2023, up 3% compared to January 2022, down 20% compared to January 2021, down 27% compared to January 2020, down 38% compared to January 2019. Month’s supply of total residential listings is steady at 4 month’s supply (seller’s market conditions) and sales to listings ratio of 43% compared to 106% in December 2023, 35% in January 2023 and 55% in January 2022. Month-over-month, the house price index is down 1.1% and in the last 6 months down 4.3%.

West Vancouver: West Vancouver saw the house price index increase 2.5% last month, but that will likely drop over the next month as sales stall in one of the highest priced neighbourhoods in the region.

Total Units Sold in January were 23 - down from 41 (44%) in December, down from 48 (52%) in November 2023, down from 28 (18%) in January 2023, down from 45 (49%) in January 2022, down from 45 (49%) in January 2021, down from 29 (21%) in January 2020, down from 26 (12%) in January 2019; Active Listings were at 483 at month end compared to 408 at that time last year and 487 at the end of December; New Listings in January were up 233% compared to December 2023, up 7% compared to November 2023, up 42% compared to January 2023, up 28% compared to January 2022, down 7% compared to January 2021, the same amount compared to January 2020, down 22% compared to January 2019. Month’s supply of total residential listings is up to 21 month’s supply (buyer’s market conditions) and sales to listings ratio of 13% compared to 76% in December 2023, 22% in January 2023 and 32% in January 2022. 

Richmond: Total Units Sold in January were 161 – down from 169 (5%) in December, down from 179 (10%) in November 2023, up from 120 (34%) in January 2023, down from 340 (53%) in January 2022, down from 277 (42%) in January 2021, down from 227 (29%) in January 2020, up from 121 (33%) in January 2019; Active Listings were at 1,014 at month end compared to 942 at that time last year and 1,043 at the end of December; New Listings in January were up 154% compared to December 2023, up 2% compared to November 2023, up 1% compared to January 2023, down 26% compared to January 2022, down 31% compared to January 2021, down 22% compared to January 2020, down 46% compared to January 2019. Month’s supply of total residential listings is steady at 6 month’s supply (balanced market conditions) and sales to listings ratio of 39% compared to 104% in December 2023, 29% in January 2023 and 61% in January 2022. Month-over-month, the house price index is down 1.1% and in the last 6 months down 4.0%. 

Burnaby East: Total Units Sold in January were 17 - down from 18 (6%) in December, up from 13 (31%) in November 2023, up from 9 (89%) in January 2023, down from 25 (32%) in January 2022, down from 28 (39%) in January 2021, down from 18 (6%) in January 2020, up from 11 (45%) in January 2019; Active Listings were at 77 at month end compared to 87 at that time last year and 75 at the end of December; New Listings in January were up 316% compared to December 2023, up 67% compared to November 2023, up 14% compared to January 2023, up 43% compared to January 2022, up 16% compared to January 2021, up 11% compared to January 2020, down 9% compared to January 2019. Month’s supply of total residential listings is up to 5 month’s supply (balanced market conditions) and sales to listings ratio of 34% compared to 150% in December 2023, 20% in January 2023 and 71% in January 2022. One of the few areas to see sales decline in January compared to December. Month-over-month, the house price index is up 0.3% and in the last 6 months down 3.5%. 

Burnaby North: Total Units Sold in January were 88 - down from 91 (3%) in December, down from 119 (26%) in November 2023, up from 63 (40%) in January 2023, down from 142 (39%) in January 2022, down from 144 (39%) in January 2021, down from 96 (8%) in January 2020, up from 65 (3%5) in January 2019; Active Listings were at 387 at month end compared to 389 at that time last year and 417 at the end of December; New Listings in January were up 137% compared to December 2023, down 1% compared to November 2023, down 8% compared to January 2023, down 23% compared to January 2022, down 24% compared to January 2021, down 12% compared to January 2020, down 15% compared to January 2019. Month’s supply of total residential listings is down to 4 month’s supply (seller’s market conditions) and sales to listings ratio of 48% compared to 117% in December 2023, 31% in January 2023 and 60% in January 2022. Month-over-month, the house price index is down 0.8% and in the last 6 months down 3.5%. 

Burnaby South: Total Units Sold in January were 102 - up from 79 (29%) in December, up from 83 (23%) in November 2023, up from 54 (89%) in January 2023, down from 150 (32%) in January 2022, down from 144 (29%) in January 2021, up from 90 (13%) in January 2020, up from 55 (85%) in January 2019; Active Listings were at 398 at month end compared to 352 at that time last year and 395 at the end of December; New Listings in January were up 185% compared to December 2023, up 29% compared to November 2023, up 32% compared to January 2023, down 12% compared to January 2022, down 18% compared to January 2021, up 2% compared to January 2020, down 24% compared to January 2019. Month’s supply of total residential listings is down to 4 month’s supply (seller’s market conditions) and sales to listings ratio of 48% compared to 105% in December 2023, 33% in January 2023 and 62% in January 2022. Month-over-month, the house price index is down 0.1% and in the last 6 months down 3.4%. 

New Westminster: Total Units Sold in January were 54 - up from 46 (17%) in December, down from 65 (17%) in November 2023, up from 40 (35%) in January 2023, down from 102 (47%) in January 2022, down from 101 (47%) in January 2021, up from 50 (8%) in January 2020, down from 75 (28%) in January 2019; Active Listings were at 242 at month end compared to 220 at that time last year and 240 at the end of December; New Listings in January were up 244% compared to December 2023, up 2% compared to November 2023, up 26% compared to January 2023, down 10% compared to January 2022, down 37% compared to January 2021, down 6% compared to January 2020, down 32% compared to January 2019. Month’s supply of total residential listings is down to 4 month’s supply (seller’s market conditions) and sales to listings ratio of 40% compared to 118% in December 2023, 38% in January 2023 and 61% in January 2022. Month-over-month, the house price index is down 0.1% and in the last 6 months down 3.7%. 

Coquitlam: Total Units Sold in January were 112 - down from 119 (6%) in December, down from 159 (30%) in November 2023, up from 73 (47%) in January 2023, down from 174 (36%) in January 2022, down from 225 (50%) in January 2021, down from 144 (22%) in January 2020, up from 87 (29%) in January 2019; Active Listings were at 521 at month end compared to 481 at that time last year and 527 at the end of December; New Listings in January were up 234% compared to December 2023, down 1% compared to November 2023, up 9% compared to January 2023, up 9% compared to January 2022, down 16% compared to January 2021, down 7% compared to January 2020, down 23% compared to January 2019. Month’s supply of total residential listings is up to 5 month’s supply (balanced market conditions) and sales to listings ratio of 39% compared to 138% in December 2023, 28% in January 2023 and 66% in January 2022. Month-over-month, the house price index is down 0.7% and in the last 6 months down 4.2%. 

Port Moody: Total Units Sold in January were 31 - up from 25 (24%) in December, down from 40 (22%) in November 2023, up from 23 (35%) in January 2023, down from 57 (46%) in January 2022, down from 46 (33%) in January 2021, down from 37 (16%) in January 2020, the same as January 2019; Active Listings were at 122 at month end compared to 188 at that time last year and 128 at the end of December; New Listings in January were up 75% compared to December 2023, up 35% compared to November 2023, down 46% compared to January 2023, down 30% compared to January 2022, down 26% compared to January 2021, down 14% compared to January 2020, down 33% compared to January 2019. Month’s supply of total residential listings is down to 4 month’s supply (seller’s market conditions) and sales to listings ratio of 55% compared to 78% in December 2023, 22% in January 2023 and 71% in January 2022. Month-over-month, the house price index is down 2.3% and in the last 6 months down 2.5%. 

Port Coquitlam: Total Units Sold in January were 43 - up from 36 (19%) in December, down from 55 (22%) in November 2023, up from 34 (26%) in January 2023, down from 77 (24%) in January 2022, down from 88 (51%) in January 2021, down from 60 (28%) in January 2020, up from 38 (13%) in January 2019; Active Listings were at 155 at month end compared to 123 at that time last year and 154 at the end of December; New Listings in January were up 87% compared to December 2023, down 19% compared to November 2023, down 6% compared to January 2023, down 30% compared to January 2022, down 54% compared to January 2021, down 43% compared to January 2020, down 49% compared to January 2019. Month’s supply of total residential listings is steady at 4 month’s supply (seller’s market conditions) and sales to listings ratio of 59% compared to 92% in December 2023, 44% in January 2023 and 73% in January 2022. Month-over-month, the house price index is down 0.4% and in the last 6 months down 4.7%. 

Pitt Meadows: Total Units Sold in January were 20 - up from 19 (5%) in December, down from 21 (5%) in November 2023, up from 15 (33%) in January 2023, down from 30 (33%) in January 2022, down from 22 (9%) in January 2021, up from 19 (5%) in January 2020, up from 10 (29%) in January 2019; Active Listings were at 57 at month end compared to 61 at that time last year and 59 at the end of December; New Listings in January were up 171% compared to December 2023, down 3% compared to November 2023, the same as January 2023, down 7% compared to January 2022, up 23% compared to January 2021, down 25% compared to January 2020, down 3% compared to January 2019. Month’s supply of total residential listings is the same at 3 month’s supply (seller’s market conditions) and sales to listings ratio of 52% compared to 135% in December 2023, 39% in January 2023 and 73% in January 2022. Month-over-month, the house price index is up 1.6% and in the last 6 months down 4.5%. 

Maple Ridge: Total Units Sold in January were 106 - up from 100 (6%) in December, up from 103 (3%) in November 2023, up from 65 (63%) in January 2023, down from 124 (15%) in January 2022, down from 194 (45%) in January 2021, down from 120 (12%) in January 2020, up from 82 (30%) in January 2019; Active Listings were at 563 at month end compared to 451 at that time last year and 579 at the end of December; New Listings in January were up 155% compared to December 2023, up 30% compared to November 2023, up 20% compared to January 2023, up 9% compared to January 2022, up 4% compared to January 2021, up 18% compared to January 2020, up 4% compared to January 2019. Month’s supply of total residential listings is down to 5 month’s supply (balanced market conditions) and sales to listings ratio of 40% compared to 98% in December 2023, 30% in January 2023 and 51% in January 2022. Month-over-month, the house price index is down 0.4% and in the last 6 months down 4.6%. 

Ladner: Total Units Sold in January were 21 - up from 12 (75%) in December, the same as November 2023, up from 16 (31%) in January 2023, down from 22 (5%) in January 2022, up from 20 (5%) in January 2021, down from 35 (40%) in January 2020, up from 16 (31%) in January 2019; Active Listings were at 83 at month end compared to 81 at that time last year and 86 at the end of December; New Listings in January were up 229% compared to December 2023, up 77% compared to November 2023, up 7% compared to January 2023, down 28% compared to January 2022, down 12% compared to January 2021, down 37% compared to January 2020, down 26% compared to January 2019. Month’s supply of total residential listings is down to 4 month’s supply (seller’s market conditions) and sales to listings ratio of 46% compared to 86% in December 2023, 37% in January 2023 and 61% in January 2022. Month-over-month, the house price index is down 0.5% and in the last 6 months down 5.6%. 

Tsawwassen: Total Units Sold in January were 24 - up from 21 (14%) in December, down from 27 (11%) in November 2023, up from 20 (20%) in January 2023, down from 42 (43%) in January 2022, down from 54 (56%) in January 2021, up from 21 (14%) in January 2020, up from 14 (71%) in January 2019; Active Listings were at 139 at month end compared to 137 at that time last year and 152 at the end of December; New Listings in January were up 183% compared to December 2023, up 13% compared to November 2023, down 11% compared to January 2023, down 35% compared to January 2022, down 43% compared to January 2021, down 27% compared to January 2020, down 30% compared to January 2019. Month’s supply of total residential listings is down to 6 month’s supply (balanced market conditions) and sales to listings ratio of 47% compared to 117% in December 2023, 35% in January 2023 and 54% in January 2022. Month-over-month, the house price index is down 1.2% and in the last 6 months down 2.6%. 

Fraser Valley: Sales in December were up 16% from December but up 52% from January 2023. New listings were up 163% from December and up 30% from January 2023. While the average price was up 4.4% month-over-month, it is up 13% year-over-year. Active listings were down 4% to 4,132 from 4,302 last month but up 6.5% from January 2023. It was a very precipitous decline over the last 3 months. Month-over-month, the house price index is down 0.4% and in the last 6 months down 5.9%. 

“With January sales on the rise, we are seeing hopeful signs that optimism is returning to the market,” said Narinder Bains, Chair of the Fraser Valley Real Estate Board. “Anticipating that we may be at the end of the Bank of Canada rate hike cycle, it appears that more buyers are considering re-entering the market as we are starting to see more traffic at open houses.” 

Kevin Skipworth, Partner/Broker and Chief Economist at Dexter Realty

Read

First Time Buyers Programs: Q&A with Stephen Jackman from ThinkMortgages

We reached out to one of our mortgage brokers with ThinkMortgages to open up a Q&A regarding several new tips for First Time Home Buyers Programs.

Stephen Jackman helped shed light on the various options available to those wishing to make the step towards purchasing. Take a look at Stephen’s thoughts on what we can expect from these programs.

What are the details regarding the First-Time Home Buyer’s incentive?

Eligible applicants who are applying for a high-ratio mortgage with a total down payment of less than 20% of the purchase price can receive a matching 5% down payment from the government to combine with their existing funds. eg. You save 5% down payment and the government will match it, therefore you have a 10% down payment. The offer goes up to 10%  for a brand new never occupied property AKA a presale. 

This is an interest-free, payment-free loan from the Government that is due to be repaid upon sale of the home or once 25 years elapse. In other words, this is a shared equity program without monthly penalties, fees or payments. 

Key Details: The program has established larger lending limits for purchases within the Vancouver and Victoria census districts. 

Household income cannot exceed $150,000 before taxes ($120,000 outside the Vancouver and Victoria census districts) 

Total borrowing including the incentive cannot exceed 4.5 times the household income. (cannot exceed 4 times the household income outside the Vancouver and Victoria census districts) 

The total borrowing in Vancouver and Victoria census districts cannot exceed $675,000 ($480,000 outside these districts). Total borrowing includes the primary mortgage and the 5% shared equity loan from the Government. 

Therefore the max purchase price in the Vancouver and Victoria census districts is $710,000 and $505,000 is the max price outside Vancouver and Victoria. 

What are the benefits of using the First Time Home Buyer’s Program?

The benefits of the FTHBI are savings! Lower total mortgage size = lower monthly costs and a lower mortgage balance upon completion of your term. Using the maximum purchase example in Vancouver and Victoria the average applicant would save approximately $150 per month on payments. $1800 difference in the first year. Over a 5-year mortgage term, this would be equal to $9000 in savings. $45,000 difference in payments over the 25-year lifespan of the mortgage loan. 

What is the First Home’s Savings Account?

A new savings account was created by the federal government to help prospective homeowners towards their down payment goals. You can make tax-deductible deposits of up to $8,000 per year for a total of $40,000 over 5 years and withdraw this money tax-free as part of a down payment for a home in Canada. This account functions exactly like a TFSA in that you can invest the monies inside the account into GICs, bonds and mutual funds. The FHSA can be opened at any major bank in Canada and can be customized and operated within your existing online banking system login. 

What is the Home Buyer’s Plan?

The home buyers plan allows prospective first-time home buyers to withdraw up to $35,000 from their RRSP to put towards the down payment on their first home purchase. You are given 15 years to repay the withdrawn money back into your RRSP during regular contribution time using an equal payment instalment plan. The program is accessed by directly contacting the institution which holds your RRSP. You can manage your own Home Buyers Plan and view the balance and payment plan using the MY CRA tax website.

 Are there any other prerequisites needed to qualify for the FHSA or the HBP?

You must be a resident of Canada and qualify as a “first-time home buyer” which by definition in Canada is having never owned a home before or lived in a home owned by your spouse or common-law partner. 

Please note there is a rare reset of this eligibility if you have owned a home in the past BUT have not owned or lived in a home owned by your spouse for the past 48 consecutive months. Eg. you owned a home, sold it and rented for 4 years- or lived in another country for 4 years, technically you are a first-time home buyer again according to the Canadian Federal Government. 

Read

Sales and Listing Report for Dec 2023

Highlights of Dexter’s December 2023 Report

  • Prices in Greater Vancouver were up 5% in 2023

  • Vancouver West Side detached prices showed an increase of 11.4% in 2023

  • Total number of New Listings were the lowest since 2001

  • Let the interest rate decreases begin

  • The Buying signal is now

It would seem interest rates and inflation have made for a bit of a roller coaster ride in real estate with numbers showing we’re likely at the bottom of this rough ride we’ve been on over the last 2 years. And while people will line up for Disney’s roller coaster, buyers and sellers chose to avoid the ride this year and the numbers certainly showed that. With near record lows for the number of new listings and sales volume declines for the second year in a row, the line up is forming for all those buyers and sellers that want to jump on a smoother ride in real estate. While we may have achieved balance in the real estate market by the end of 2023, will that continue in 2024? Once the Bank of Canada starts to decrease its rate, that will bring more buyers off the sidelines and create competition. Fixed rates have already started to decline. So, for those buyers ready to buy now, this is your buying signal. 

January rings in the new year and with that comes every property owner’s assessed value from B.C. Assessment. Perhaps talked about more than new year resolutions as everyone looks to see how their properties scored compared to others. It’s important to remember though that these assessments may not accurately reflect market value and these valuations were done up to July 1, 2023. In the Lower Mainland, the total assessed value of properties was up 3% compared to 2023. With Vancouver seeing a typical property up 4%, one of the highest in the region, along with Burnaby and Coquitlam while most other suburbs were at 2% and municipalities in the Fraser Valley showing a decrease of 2 to 3%. Hope had the highest decline at 13%. BC Assessment Assessor Bryan Murao said, "Most homeowners can expect only modest changes in the range of -5% to +5%. These assessment changes are notably less than previous years."  

At least we beat January, as the 1,345 properties sold in December were higher than the 1,030 sales at the start of 2023 in January. That can be seen as a positive after a year where the real estate market limped along. This after there were 1,702 properties of all types sold in Greater Vancouver in November and 1,996 sales in October. But at least there were more sales this December compared to last year where 1,303 properties sold in the last month of 2022. But still sales in December were 37% below the 10-year average after November’s sales were at 35% below the 10-year average. 

Overall, there were 26,249 sales in 2023 which was down from the 29,227 in 2022, and much less than the 44,944 sales in the fast-paced 2021. Total sales for the year were 23 per cent below the 10-year average. The last two down years were 2018 and 2019 with 25,051 and 25,679 sales respectively in those years.  Like 2022 with the first six months having the majority of sales, 2023 was no different due to interest rate hikes having their way. In the last half of 2023 there were 11,720 sales compared to 10,348 in the last half of 2022. While it’s early to call it, there is a sense of momentum change. What’s needed to help that shift in the market is more listings. There will be real estate transactions in 2024, just how many will be a function of the number of listings that come on. Sellers, buyers are waiting for you!

With current sales, we are in a balanced market with 7 months supply of homes overall in Greater Vancouver, ticking up from 6 months supply in November. With such a low volume of sales, it’s not surprising to see this. Vancouver’s West Side and West Vancouver are showing numbers above 7 months which indicates a buyer’s market. While North Vancouver, Burnaby Coquitlam, Port Coquitlam, and Pitt Meadows continue to see the shortage of listings resulting in seller’s market conditions with less than 5 months supply.  

There were only 1,355 new listings in December after 3,440 new listings in November, 4,752 new listings in October, and 5,557 new listings in September, and slightly higher than the number of new listings in December last year at 1,240. For the year, there were 50,883 new listings in Greater Vancouver, which was below the 55,028 in 2022, and 63,711 in 2021. It was also lower than the two previous down years of 2018 and 2019 where there were 55,057 and 53,267 new listings respectively. 

The number of new listings in December dropped to 25% below the 10-year average after being close to or above the average in the last 3 months: 3% below the 10-year average in November, 5% above the average in October and 6% above the average in September. For the year, new listings were 11% below the 10-year average. With these few listings it’s not surprising to see prices climb 5% year-over-year in Greater Vancouver even amid sales that were 23% below the 10-year average. A resilient market indeed.

There were 8,802 active listings in Greater Vancouver at the end of December after November finished with 10,931, compared with 11,599 active listings at the end of October and 11,382 active listings at the end of September. After several listings expired at the end of December, January started with 7,828 active listings. Last year at the end of December there were 7,791 active listings and January 2023 started with 6,853. While we do have more listings to work with currently, there are less than the 10,907 at the end of 2018 and far below the 13,902 active listing at the end of 2012. The detached market overall remains in buyer’s market territory with 9 months supply of inventory but during the month of December the absorption rate was at 91%. Townhomes and condos continue to sit just above 5 months supply of listings on the border of a seller’s market with 106% of new townhome listings selling in December and 104% of condo new listings selling that month.  

We do not have a speculation problem; we have a holding problem. More and more real estate is held instead of sold. After 25 years, the number of listings should be higher, the number of transactions should be higher. With our population growing and demographics shifting to produce more buyers, discouraging homeowners from selling will do more harm than good. The proposed anti-flipping tax tabled by the B.C. NDP along with other demand side policies will produce less listings for buyers and put more pressure on prices to increase. Government needs to entice sellers to come to the market and until policy shifts in that direction, we’ll continue to have a holding problem and with limited supply.

Here’s a summary of the numbers:

Greater Vancouver: Month-over-month, the house price index is down 2.9% in the last quarter but up 5.0% year-over-year. 

Total Units Sold in December were 1,345 down from 1,702 (21%) in November 2023, down from 1,996 (33%) in October 2023, up from 1,303 (3%) in December 2022, down from 2,737 (51%) in December 2021, down from 3,157 (57%) in December 2020, down from 2,046 (34%) in December 2019, up from 1,094 (23%) in December 2018; Active Listings were at 8,802 at month end compared to 7,791 at that time last year and 10,931 at the end of November; New Listings in December were down 21% compared to November 2023, down 71% compared to October 2023, up 9% compared to December 2022, down 32% compared to December 2021, down 46% compared to December 2020, down 19% compared to December 2019 and up 7% compared to December 2018. Month’s supply of total residential listings is up to 7 month’s supply (balanced to buyer’s market conditions – detached homes up to 9 months supply, a buyer’s market) and sales to listings ratio of 99% compared to 49% in November 2023, 105% in December 2022 and 138% in December 2021. 

Vancouver Westside: The detached home price index was down 2.5% in the last quarter, but up 11.4% over last year – the highest in the region. A sign at how much equity and less reliant on mortgages Vancouver is. Overall, the benchmark home price index in Vancouver’s West Side was up 5.4% while on the East Side it was up 7.4%. West Side condos saw their benchmark price up 1.9% year-over-year – opportunity for some buyers in that market. 

Total Units Sold in December were 235 down from 315 (25%) in November 2023, down from 352 (33%) in October 2023, down from 244 (4%) in December 2022, down from 468 (50%) in December 2021, down from 486 (52%) in December 2020, down from 356 (34%) in December 2019, up from 190 (24%) in December 2018; Active Listings were at 1,998 at month end compared to 1,869 at that time last year and 2,432 at the end of November; New Listings in December were down 63% compared to November 2023, down 75% compared to October 2023, up 2% compared to December 2022, down 38% compared to December 2021, down 42% compared to December 2020, down 19% compared to December 2019 and down 5% compared to December 2018. Month’s supply of total residential listings is up to 9 month’s supply (buyer’s market conditions) and sales to listings ratio of 95% compared to 47% in November 2023, 100% in December 2022 and 118% in December 2021.

Vancouver East Side: The benchmark price index was down 3% in the last quarter but up 7.4% over last year – with detached homes posting a 10.3% year-over-year increase which was second highest in the region. 

Total Units Sold in December were 148 down from 175 (15%) in November 2023, down from 231 (36%) in October 2023, up from 122 (21%) in December 2022, down from 295 (50%) in December 2021, down from 348 (53%) in December 2020, down from 208 (29%) in December 2019, up from 113 (31%) in December 2018; Active Listings were at 977 at month end compared to 880 at that time last year and 1,238 at the end of November; New Listings in December were down 64% compared to November 2023, down 74% compared to October 2023, up 3% compared to December 2022, down 31% compared to December 2021, down 45% compared to December 2020, down 8% compared to December 2019 and up 11% compared to December 2018. Month’s supply of total residential listings is steady at 7 month’s supply (buyer’s market conditions) and sales to listings ratio of 100% compared to 43% in November 2023, 85% in December 2022 and 137% in December 2021.

North Vancouver: Again, one of the few seller’s markets for inventory in Metro Vancouver. The benchmark price index was down 1.7% in the last quarter and up 5.2% year-over-year.

Total Units Sold in December were 106 down from 157 (32%) in November 2023, down from 194 (45%) in October 2023, down from 107 (1%) in December 2022, down from 195 (46%) in December 2021, down from 250 (58%) in December 2020, down from 155 (32%) in December 2019, up from 99 (1%) in December 2018; Active Listings were at 392 at month end compared to 385 at that time last year and 560 at the end of November; New Listings in December were down 62% compared to November 2023, down 73% compared to October 2023, up 24% compared to December 2022, down 17% compared to December 2021, down 39% compared to December 2020, down 10% compared to December 2019 and up 27% compared to December 2018. Month’s supply of total residential listings is steady at 4 month’s supply (seller’s market conditions) and sales to listings ratio of 106% compared to 59% in November 2023, 132% in December 2022 and 163% in December 2021.

West Vancouver: West Vancouver saw the house price index drop 4.9% last quarter and posted a 0.9% decline year-over-year. One of the only areas in Greater Vancouver other than the Sunshine Coast and Bowen Island to decline in 2023.  

Total Units Sold in December were 41 down from 48 (15%) in November 2023, down from 53 (23%) in October 2023, up from 40 (3%) in December 2022, down from 62 (34%) in December 2021, down from 82 (50%) in December 2020, down from 46 (11%) in December 2019, up from 30 (37%) in December 2018; Active Listings were at 487 at month end compared to 448 at that time last year and 593 at the end of November; New Listings in December were down 62% compared to November 2023, down 68% compared to October 2023, up 15% compared to December 2022, up 8% compared to December 2021, down 19% compared to December 2020, down 10% compared to December 2019 and down 16% compared to December 2018. Month’s supply of total residential listings is steady at 12 month’s supply (buyer’s market conditions) and sales to listings ratio of 76% compared to 34% in November 2023, 85% in December 2022 and 124% in December 2021

Richmond: The benchmark price index declined 2.6% in the last quarter and was up 6% in 2023 with condos leading the way at 8.9%.

Total Units Sold in December were 169 down from 179 (6%) in November 2023, down from 217 (22%) in October 2023, down from 171 (1%) in December 2022, down from 387 (56%) in December 2021, down from 343 (51%) in December 2020, down from 281 (40%) in December 2019, up from 122 (39%) in December 2018; Active Listings were at 1,043 at month end compared to 919 at that time last year and 1,258 at the end of November; New Listings in December were down 60% compared to November 2023, down 66% compared to October 2023, down 6% compared to December 2022, up 41% compared to December 2021, down 46% compared to December 2020, down 36% compared to December 2019 and down 19% compared to December 2018. Month’s supply of total residential listings is down to 6 month’s supply (balanced market conditions) and sales to listings ratio of 104% compared to 44% in November 2023, 99% in December 2022 and 140% in December 2021.

Burnaby East: The benchmark price index declined 1.9% in the last quarter and was up 6% in 2023 with detached homes leading the way at 9.5%.

Total Units Sold in December were 18 up from 13 (39%) in November 2023, down from 21 (14%) in October 2023, up from 12 (50%) in December 2022, down from 32 (44%) in December 2021, down from 41 (56%) in December 2020, down from 24 (25%) in December 2019, up from 17 (6%) in December 2018; Active Listings were at 75 at month end compared to 76 at that time last year and 93 at the end of November; New Listings in December were down 60% compared to November 2023, down 75% compared to October 2023, down 14% compared to December 2022, down 45% compared to December 2021, down 37% compared to December 2020, down 43% compared to December 2019 and down 40% compared to December 2018. Month’s supply of total residential listings is down to 4 month’s supply (seller’s market conditions) and sales to listings ratio of 150% compared to 43% in November 2023, 86% in December 2022 and 145% in December 2021.

Burnaby North: The benchmark price index declined 2% in the last quarter and was up 3.3% in 2023 with detached homes leading the way at 9%.

Total Units Sold in December were 91 down from 119 (23%) in November 2023, down from 137 (34%) in October 2023, up from 78 (17%) in December 2022, down from 157 (42%) in December 2021, down from 171 (47%) in December 2020, down from 113 (19%) in December 2019, up from 50 (82%) in December 2018; Active Listings were at 417 at month end compared to 353 at that time last year and 549 at the end of November; New Listings in December were down 58% compared to November 2023, down 73% compared to October 2023, up 11% compared to December 2022, down 35% compared to December 2021, down 53% compared to December 2020, up 11% compared to December 2019 and down 2% compared to December 2018. Month’s supply of total residential listings is steady at 5 month’s supply (balanced market conditions) and sales to listings ratio of 117% compared to 64% in November 2023, 111% in December 2022 and 130% in December 2021.

Burnaby South: The benchmark price index declined 2.7% in the last quarter and was up 4% in 2023 with townhomes leading the way at 9.6%.

Total Units Sold in December were 79 down from 83 (5%) in November 2023, down from 120 (34%) in October 2023, down from 94 (16%) in December 2022, down from 186 (57%) in December 2021, down from 148 (57%) in December 2020, down from 132 (40%) in December 2019, up from 51 (55%) in December 2018; Active Listings were at 395 at month end compared to 344 at that time last year and 487 at the end of November; New Listings in December were down 55% compared to November 2023, down 67% compared to October 2023, up 27% compared to December 2022, down 44% compared to December 2021, down 48% compared to December 2020, down 4% compared to December 2019 and down 26% compared to December 2018. Month’s supply of total residential listings is down to 5 month’s supply (balanced market conditions) and sales to listings ratio of 105% compared to 50% in November 2023, 159% in December 2022 and 138% in December 2021. 

New Westminster: With an average price of $800,300, New Westminster continues to scream opportunity but with a slow listing month, that may not last long. The benchmark price index declined 3% in the last quarter and was up 5.3% in 2023 with both detached homes and condos leading the way at 6.6%.

Total Units Sold in December were 46 down from 65 (29%) in November 2023, down from 81 (43%) in October 2023, down from 53 (7%) in December 2022, down from139 (67%) in December 2021, down from 151 (69%) in December 2020, down from 77 (40%) in December 2019, down from 58 (21%) in December 2018; Active Listings were at 240 at month end compared to 219 at that time last year and 302 at the end of November; New Listings in December were down 70% compared to November 2023, down 74% compared to October 2023, up 35% compared to December 2022, down 54% compared to December 2021, down 58% compared to December 2020, down 23% compared to December 2019 and down 15% compared to December 2018. Month’s supply of total residential listings is steady at 5 month’s supply (balanced market conditions) and sales to listings ratio of 118% compared to 50% in November 2023, 183% in December 2022 and 164% in December 2021.

Coquitlam: The benchmark price index declined 2.3% in the last quarter and was up 3.4% in 2023 with detached homes leading the way at 6.4%.

Total Units Sold in December were 119 down from 159 (25%) in November 2023, down from 167 (29%) in October 2023, up from 81 (47%) in December 2022, down from 216 (45%) in December 2021, down from 309 (61%) in December 2020, down from 197 (40%) in December 2019, up from 89 (34%) in December 2018; Active Listings were at 527 at month end compared to 452 at that time last year and 721 at the end of November; New Listings in December were down 70% compared to November 2023, down 79% compared to October 2023, up 13% compared to December 2022, down 44% compared to December 2021, down 59% compared to December 2020, down 37% compared to December 2019 and down 37% compared to December 2018. Month’s supply of total residential listings is down to 4 month’s supply (seller’s market conditions) and sales to listings ratio of 138% compared to 55% in November 2023, 107% in December 2022 and 140% in December 2021.

Port Moody: The benchmark price index declined 0.6% in the last quarter and was up 3.8% in 2023 with townhomes leading the way at 8.3%.

Total Units Sold in December were 25 down from 40 (37%) in November 2023, down from 51 (51%) in October 2023, down from 41 (39%) in December 2022, down from 52 (52%) in December 2021, down from 78 (68%) in December 2020, down from 37 (32%) in December 2019, up from 29 (14%) in December 2018; Active Listings were at 128 at month end compared to 155 at that time last year and 166 at the end of November; New Listings in December were down 63% compared to November 2023, down 62% compared to October 2023, down 24% compared to December 2022, down 18% compared to December 2021, down 37% compared to December 2020, up 14% compared to December 2019 and up 100% compared to December 2018. Month’s supply of total residential listings is up to 5 month’s supply (balanced market conditions) and sales to listings ratio of 78% compared to 47% in November 2023, 98% in December 2022 and 133% in December 2021.

Port Coquitlam: The benchmark price index declined 2.5% in the last quarter and was up 5.4% in 2023 with detached homes leading the way at 7.9%.

Another one of the few municipalities with seller’s market conditions. Total Units Sold in December were 36 down from 55 (34%) in November 2023, down from 54 (33%) in October 2023, down from 37 (3%) in December 2022, down from 107 (66%) in December 2021, down from 105 (66%) in December 2020, down from 84 (57%) in December 2019, down from 51 (29%) in December 2018; Active Listings were at 154 at month end compared to 140 at that time last year and 183 at the end of November; New Listings in December were down 57% compared to November 2023, down 66% compared to October 2023, down 11% compared to December 2022, down 41% compared to December 2021, down 62% compared to December 2020, down 32% compared to December 2019 and down 2% compared to December 2018. Month’s supply of total residential listings is up to 4 month’s supply (seller’s market conditions) and sales to listings ratio of 92% compared to 61% in November 2023, 84% in December 2022 and 162% in December 2021.

Pitt Meadows: The benchmark price index declined 4.5% in the last quarter and was up 4.4% in 2023 with condos leading the way at 7.1%.

Total Units Sold in December were 19 down from 21 (9%) in November 2023, down from 21 (9%) in October 2023, down from 23 (17%) in December 2022, down from 33 (42%) in December 2021, down from 26 (27%) in December 2020, down from 27 (30%) in December 2019, up from 11 (27%) in December 2018; Active Listings were at 59 at month end compared to 54 at that time last year and 83 at the end of November; New Listings in December were down 56% compared to November 2023, down 70% compared to October 2023, up 16% compared to December 2022, down 50% compared to December 2021, down 30% compared to December 2020, up 8% compared to December 2019 and down 18% compared to December 2018. Month’s supply of total residential listings is down to 3 month’s supply (seller’s market conditions) and sales to listings ratio of 135% compared to 53% in November 2023, 191% in December 2022 and 117% in December 2021. 

Maple Ridge: The benchmark price index declined 3.8% in the last quarter and was up 5.5% in 2023 with detached homes leading the way at 6.7%.

Total Units Sold in December were 100 down from 103 (3%) in November 2023, down from 110 (9%) in October 2023, up from 78 (28%) in December 2022, down from 159 (37%) in December 2021, down from 214 (53%) in December 2020, down from 130 (23%) in December 2019, up from 73 (37%) in December 2018; Active Listings were at 579 at month end compared to 442 at that time last year and 718 at the end of November; New Listings in December were down 49% compared to November 2023, down 69% compared to October 2023, up 56% compared to December 2022, down 6% compared to December 2021, down 38% compared to December 2020, down 3% compared to December 2019 and up 44% compared to December 2018. Month’s supply of total residential listings is down to 6 month’s supply (balanced market conditions) and sales to listings ratio of 98% compared to 51% in November 2023, 120% in December 2022 and 145% in December 2021. 

Ladner: The benchmark price index declined 4.8% in the last quarter and was up 5.9% in 2023 with townhomes leading the way at 9.4%.

Total Units Sold in December were 12 down from 21 (43%) in November 2023, down from 24 (50%) in October 2023, up from 9 (33%) in December 2022, down from 21 (43%) in December 2021, down from 34 (65%) in December 2020, down from 20 (40%) in December 2019, down from 23 (48%) in December 2018; Active Listings were at 86 at month end compared to 72 at that time last year and 104 at the end of November; New Listings in December were down 46% compared to November 2023, down 68% compared to October 2023, the same compared to December 2022, up 17% compared to December 2021, down 53% compared to December 2020, down 53% compared to December 2019 and the same compared to December 2018. Month’s supply of total residential listings is up to 7 month’s supply (balanced market conditions) and sales to listings ratio of 86% compared to 81% in November 2023, 64% in December 2022 and 175% in December 2021. 

Tsawwassen: The benchmark price index declined 3.4% in the last quarter and was up 6.4% in 2023 with detached homes leading the way at 8.8%.

Total Units Sold in December were 21 up from 20 (5%) in November 2023, down from 27 (22%) in October 2023, down from 23 (9%) in December 2022, down from 43 (51%) in December 2021, down from 74 (72%) in December 2020, down from 26 (19%) in December 2019, up from 13 (38%) in December 2018; Active Listings were at 152 at month end compared to 130 at that time last year and 180 at the end of November; New Listings in December were down 60% compared to November 2023, down 76% compared to October 2023, down 10% compared to December 2022, down 10% compared to December 2021, down 58% compared to December 2020, down 5% compared to December 2019 and up 39% compared to December 2018. Month’s supply of total residential listings is down to 7 month’s supply (balanced market conditions) and sales to listings ratio of 117% compared to 44% in November 2023, 115% in December 2022 and 215% in December 2021. 

Fraser Valley: Sales in December were down 7% from November but up 19% from December 2022. New listings were down 56% from November but up 16% from December 2022. While the average price was down 2.5% month-over-month, it is up 4% from December 2022. Active listings were down 30% to 3,992 from 5,726 last month but up 4% from December 2022. “Back-to-back mid-year interest rate hikes slowed the market despite strong sales and new listings in the spring,” said Narinder Bains, Chair of the Fraser Valley Real Estate Board. “This left the market in overall balance for the latter half of the year, albeit at low levels of activity. We anticipate 2024 will bring increased optimism on behalf of buyers and sellers as the Bank of Canada is expected to lower interest rates before mid-year.” 

Kevin Skipworth, Partner/Broker and Chief Economist at Dexter Realty

Read

What is coming to the Housing Market in 2024?

The B.C. Provincial Government passed legislation this fall that will have the following impact on housing in 2024 throughout the province. Their goal is to provide more housing, provide new homes faster and keep prices from rising at the rates they have over the last decades. We have a housing affordability crisis in British Columbia, and more so in Metro Vancouver and other metropolitan regions of the province. This is an ambitious plan and requires all stakeholders to align. 

If you need help navigating these changes or have questions on how this affects you, talk to one of our Dexter Realty agents.

Short Term Rental Accommodation Restrictions: 

On October 26, 2023, the B.C. government passed the Short-Term Rental Accommodations Act. This gives local governments stronger tools to enforce short-term rental bylaws, return short-term rental units to the long-term rental housing market and establish a new Provincial role in regulating short-term rentals. B.C. has made regulations which will restrict short-term rentals to principal residences and either a secondary suite or an accessory dwelling unit (ADU) in many B.C. communities, starting May 1, 2024. 

  • The principal resident requirement applies across B.C. in municipalities with a population of 10,000 and over, as well as smaller neighbouring communities.

  • The maximum municipal ticketing fine that a local government may set has increased from $1,000 to $3,000 per infraction, per day

  • The Act will not apply to reserve lands, Nisga’a Lands or the Treaty Lands of a Treaty First Nation, hotels/motels, and a vehicle such as an RV

https://www2.gov.bc.ca/gov/content/housing-tenancy/short-term-rentals/short-term-rental-legislation 

Expansion of the Speculation and Vacancy Tax to the following areas:

The Speculation and Vacancy Tax was introduced in 2018 in British Columbia and is an annual tax based on how owners use residential properties in areas in B.C. affected most by the current housing shortage crisis. For any homes which attract the tax that are not exempt, the tax based on assessed value is 2% for foreign owners and satellite families and 0.5% for Canadian citizens or permanent residents of Canada who are not members of a satellite family. There are exemptions which an owner can apply for, which can be found on the provincial government website regarding the Speculation and Vacancy Tax. Each owner on the title must complete their own declaration regardless of whether the property is exempt or not if the property is in the affected area, and these declarations must be done by March 31. Any tax owing would be due on the first business day of the following July.

The following areas were added to the Speculation and Vacancy Tax for 2024. You can use this interactive map to see if your property would be in an area that would require a declaration as a taxable area. https://map-spec-tax-areas.apps.gov.bc.ca/ 

  • Vernon, Coldstream;

  • Penticton, Summerland;

  • Lake Country, Peachland;

  • Courtenay, Comox, Cumberland;

  • Parksville, Qualicum Beach;

  • Salmon Arm; and

  • Kamloops.

For more information on the Speculation and Vacancy Tax please go to this link: https://www2.gov.bc.ca/gov/content/taxes/speculation-vacancy-tax 

Homes For People Action Plan

The B.C. government has introduced new housing legislation to deliver more small-scale, multi-unit housing for people, including townhomes, triplexes, and laneway homes, and to fix outdated zoning rules to help build more homes faster. Also, they will require municipalities to update bylaws to allow for secondary suites. Through Bill 44 and Bill 46, their goal is to provide homes for the “missing middle” and improve the speed at which they come to the market. Municipalities will have until June 30, 2024, to update their zoning bylaws to meet the legislative requirements. They will also be required to update their housing needs report to understand current housing needs over the next 20 years.  

  • Permit secondary suites in single-family dwellings or additional dwelling units

  • A pilot program will provide a forgivable loan of up to $40,000 to people to convert a portion of their home into a secondary suite to rent out at below-market rates.

  • Permit three to four units on lots currently zoned for single-family or duplex use, depending on lot size.

  • Permit six units permitted on larger lots currently zoned for single-family or duplex use and close to transit stops with frequent service.

  • Eliminating the need for public hearings for OCP-compliant projects

  • Structure for Development Cost Charges

This link provides information on these legislative changes and a provincial policy manual on how this will apply to communities.

https://www2.gov.bc.ca/gov/content/housing-tenancy/local-governments-and-housing/housing-initiatives#transit-oriented-development-areas

Transit Orientated Development 

This legislation is an approach to land use planning that locates high-density, mixed-use development within walking distance from frequent transit services. The goal is to provide more housing where it is best suited and to create complete, livable, and sustainable communities by building these homes near transit and services. 

  • The new legislation will require some municipalities to designate Transit-Oriented Development Areas (TOD Areas) near transit hubs. These TOD Areas are defined as areas within 800 metres of a rapid transit station (e.g., SkyTrain station) and 400 metres of a bus exchange and West Coast Express that the Province has listed in regulations.

  • Ensure minimum levels of density, size, and dimension established by the Province in regulations are allowed in TOD Areas. These will vary by municipality and may vary within the TOD Area. Local governments can approve densities that exceed the provincial regulations at their discretion.

  • Remove restrictive parking minimums for off-street residential and allow parking volumes to be set by the market need and demand.

  • There have been 52 areas designated to take immediate effect, and by June 30, 2024, local governments must list the transit stations designated for Transit Orientated Development.

This link provides information on Transit Orientated Development along with the areas designated for this and the policy manual for this legislation.

https://www2.gov.bc.ca/gov/content/housing-tenancy/local-governments-and-housing/housing-initiatives#transit-oriented-development-areas

It is important to understand that while this legislation has been passed, there are still decisions that municipalities need to make and implement for the legislation to be fully understood and put into practice. The framework has been created, now the structure inside it will come in the months ahead.

Please reach out if we can assist further with information or how these changes may impact your real estate decisions. Our Dexter agents are ready to help!

Read
Reciprocity Logo The data relating to real estate on this website comes in part from the MLS® Reciprocity program of either the Greater Vancouver REALTORS® (GVR), the Fraser Valley Real Estate Board (FVREB) or the Chilliwack and District Real Estate Board (CADREB). Real estate listings held by participating real estate firms are marked with the MLS® logo and detailed information about the listing includes the name of the listing agent. This representation is based in whole or part on data generated by either the GVR, the FVREB or the CADREB which assumes no responsibility for its accuracy. The materials contained on this page may not be reproduced without the express written consent of either the GVR, the FVREB or the CADREB.